Customer Review Analysis
Perform customer review analysis using Markov's AI Workflows and build a dashboard to visualize the results.
Customer Review Analysis Using AI Workflows
Analyzing customer feedback can reveal valuable insights—what customers love, what needs improvement, and how they feel about specific products or services. In this tutorial, you will learn how to analyze customer reviews using Markov's AI Workflows.
Let's get started!
Step 1: Upload Your Customer Review Data
The first step is to bring your customer review data into the system. MarkovML supports various input options for adding data to your workflow, such as from local files (e.g., CSVs), URLs linking to CSV files, Google Sheets, databases like PostgreSQL, S3, Snowflake, and more.
For this tutorial, let’s use a local file as an Input, like a CSV with product reviews from Etsy.
How to Upload Your Data
-
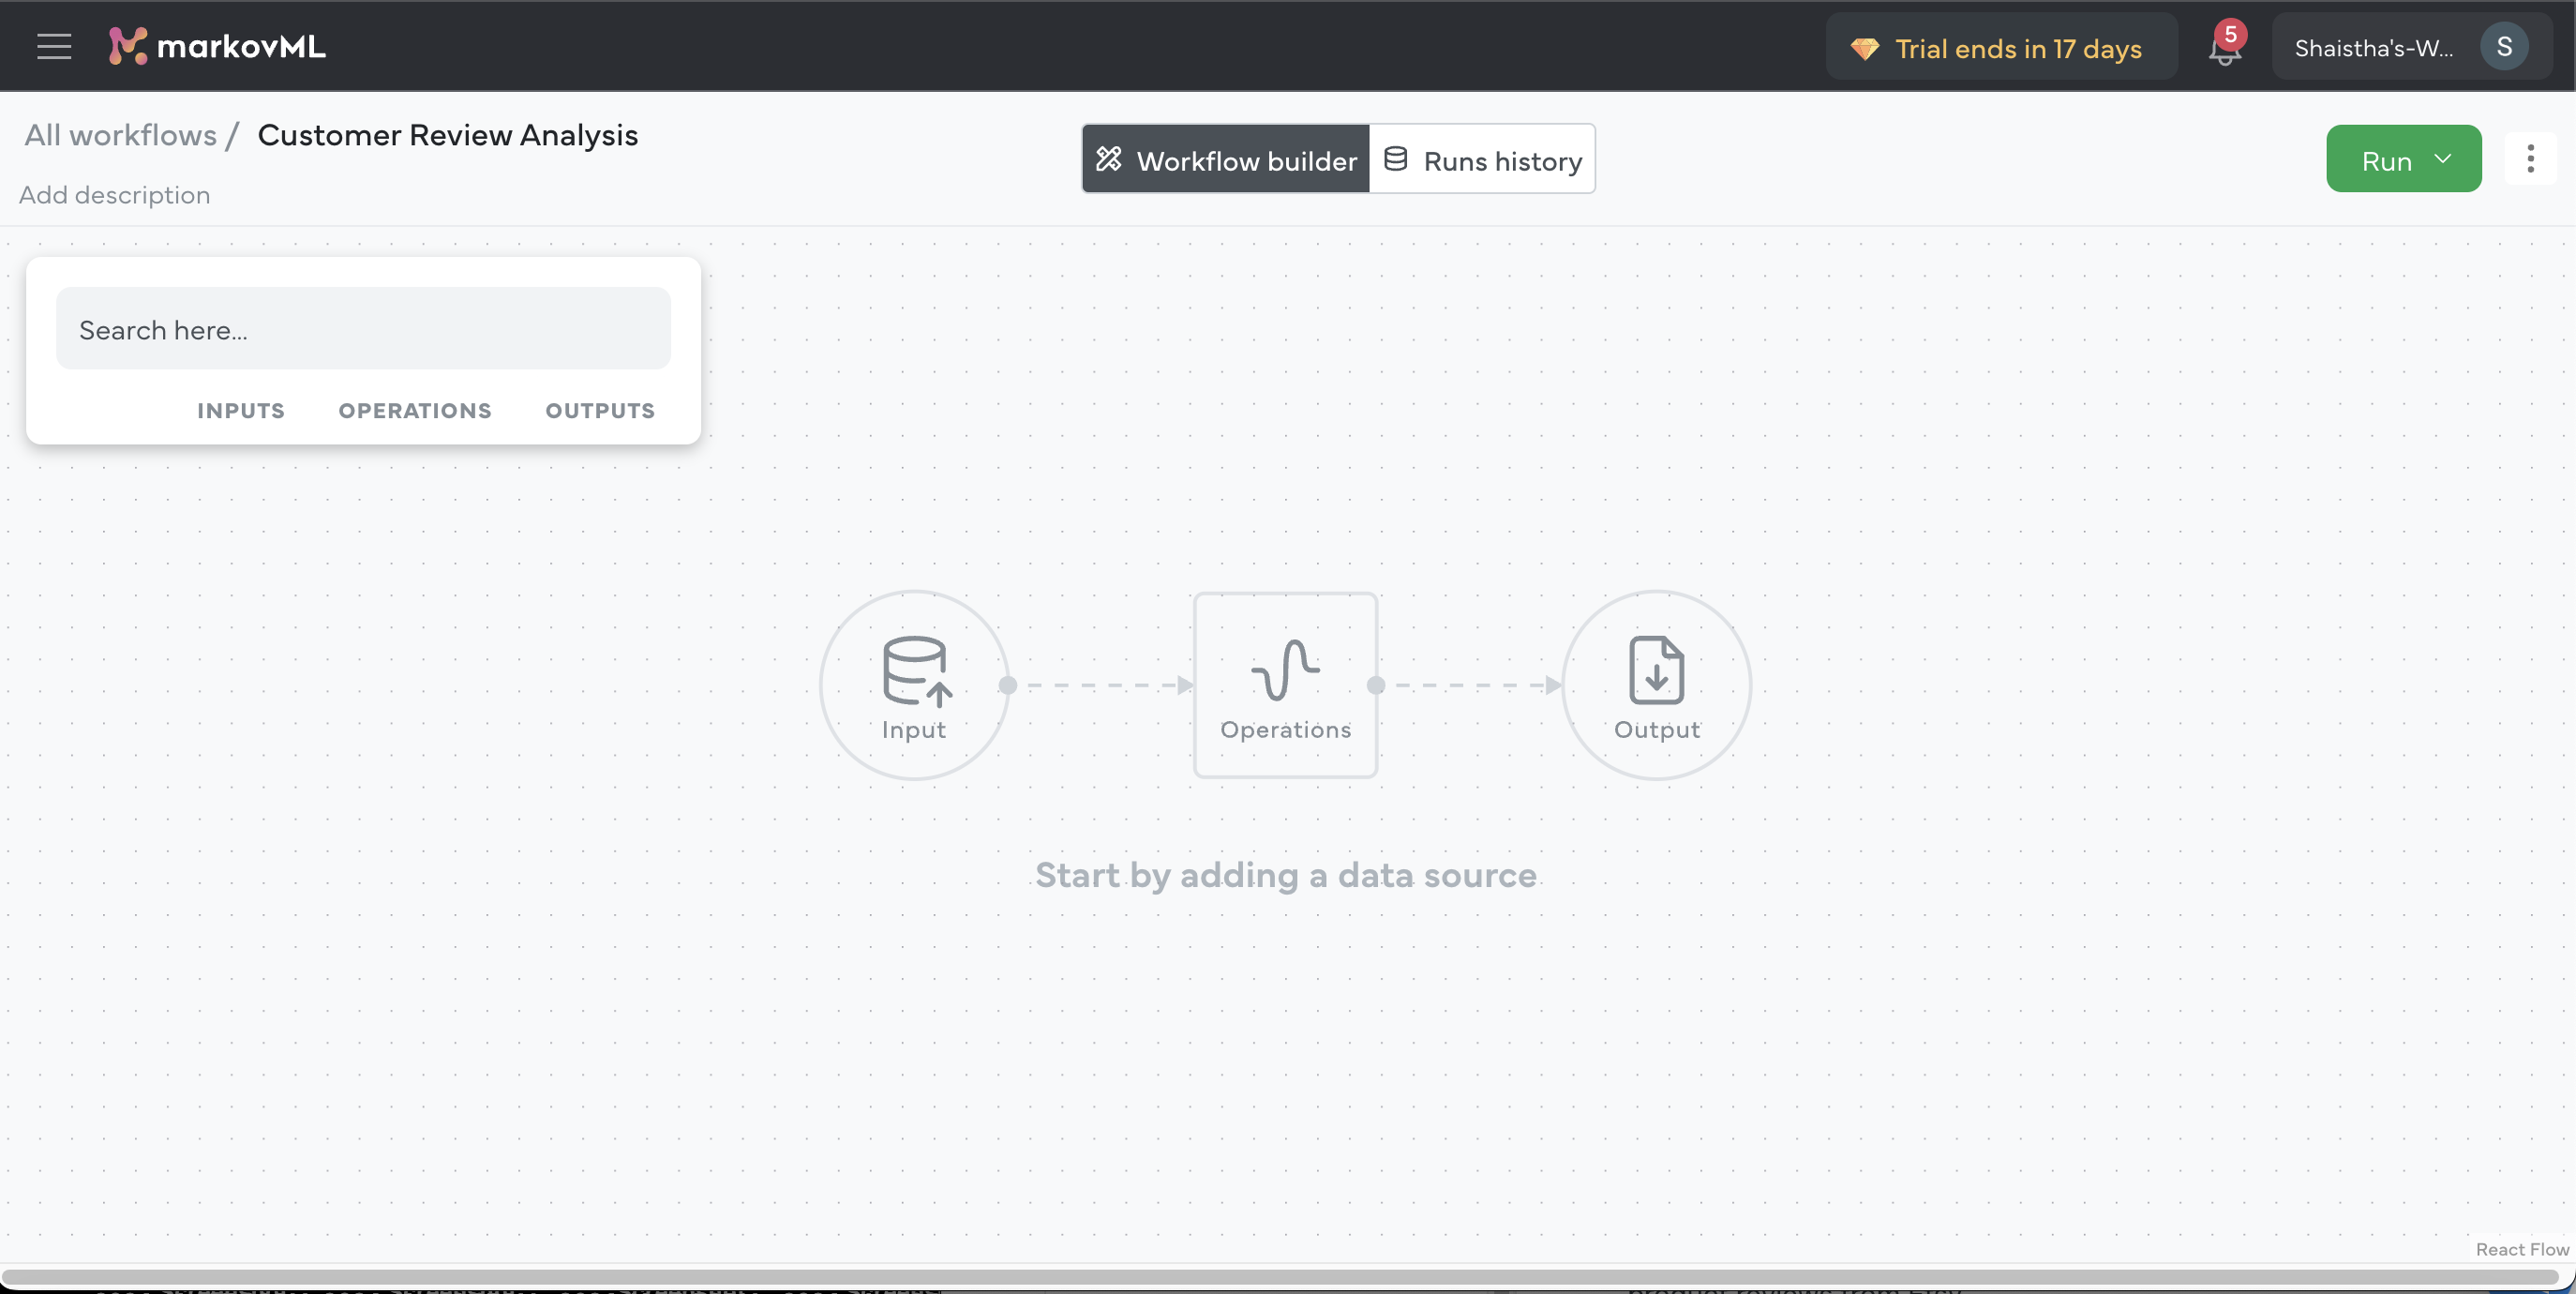
Go to the Workflow Builder page.
-
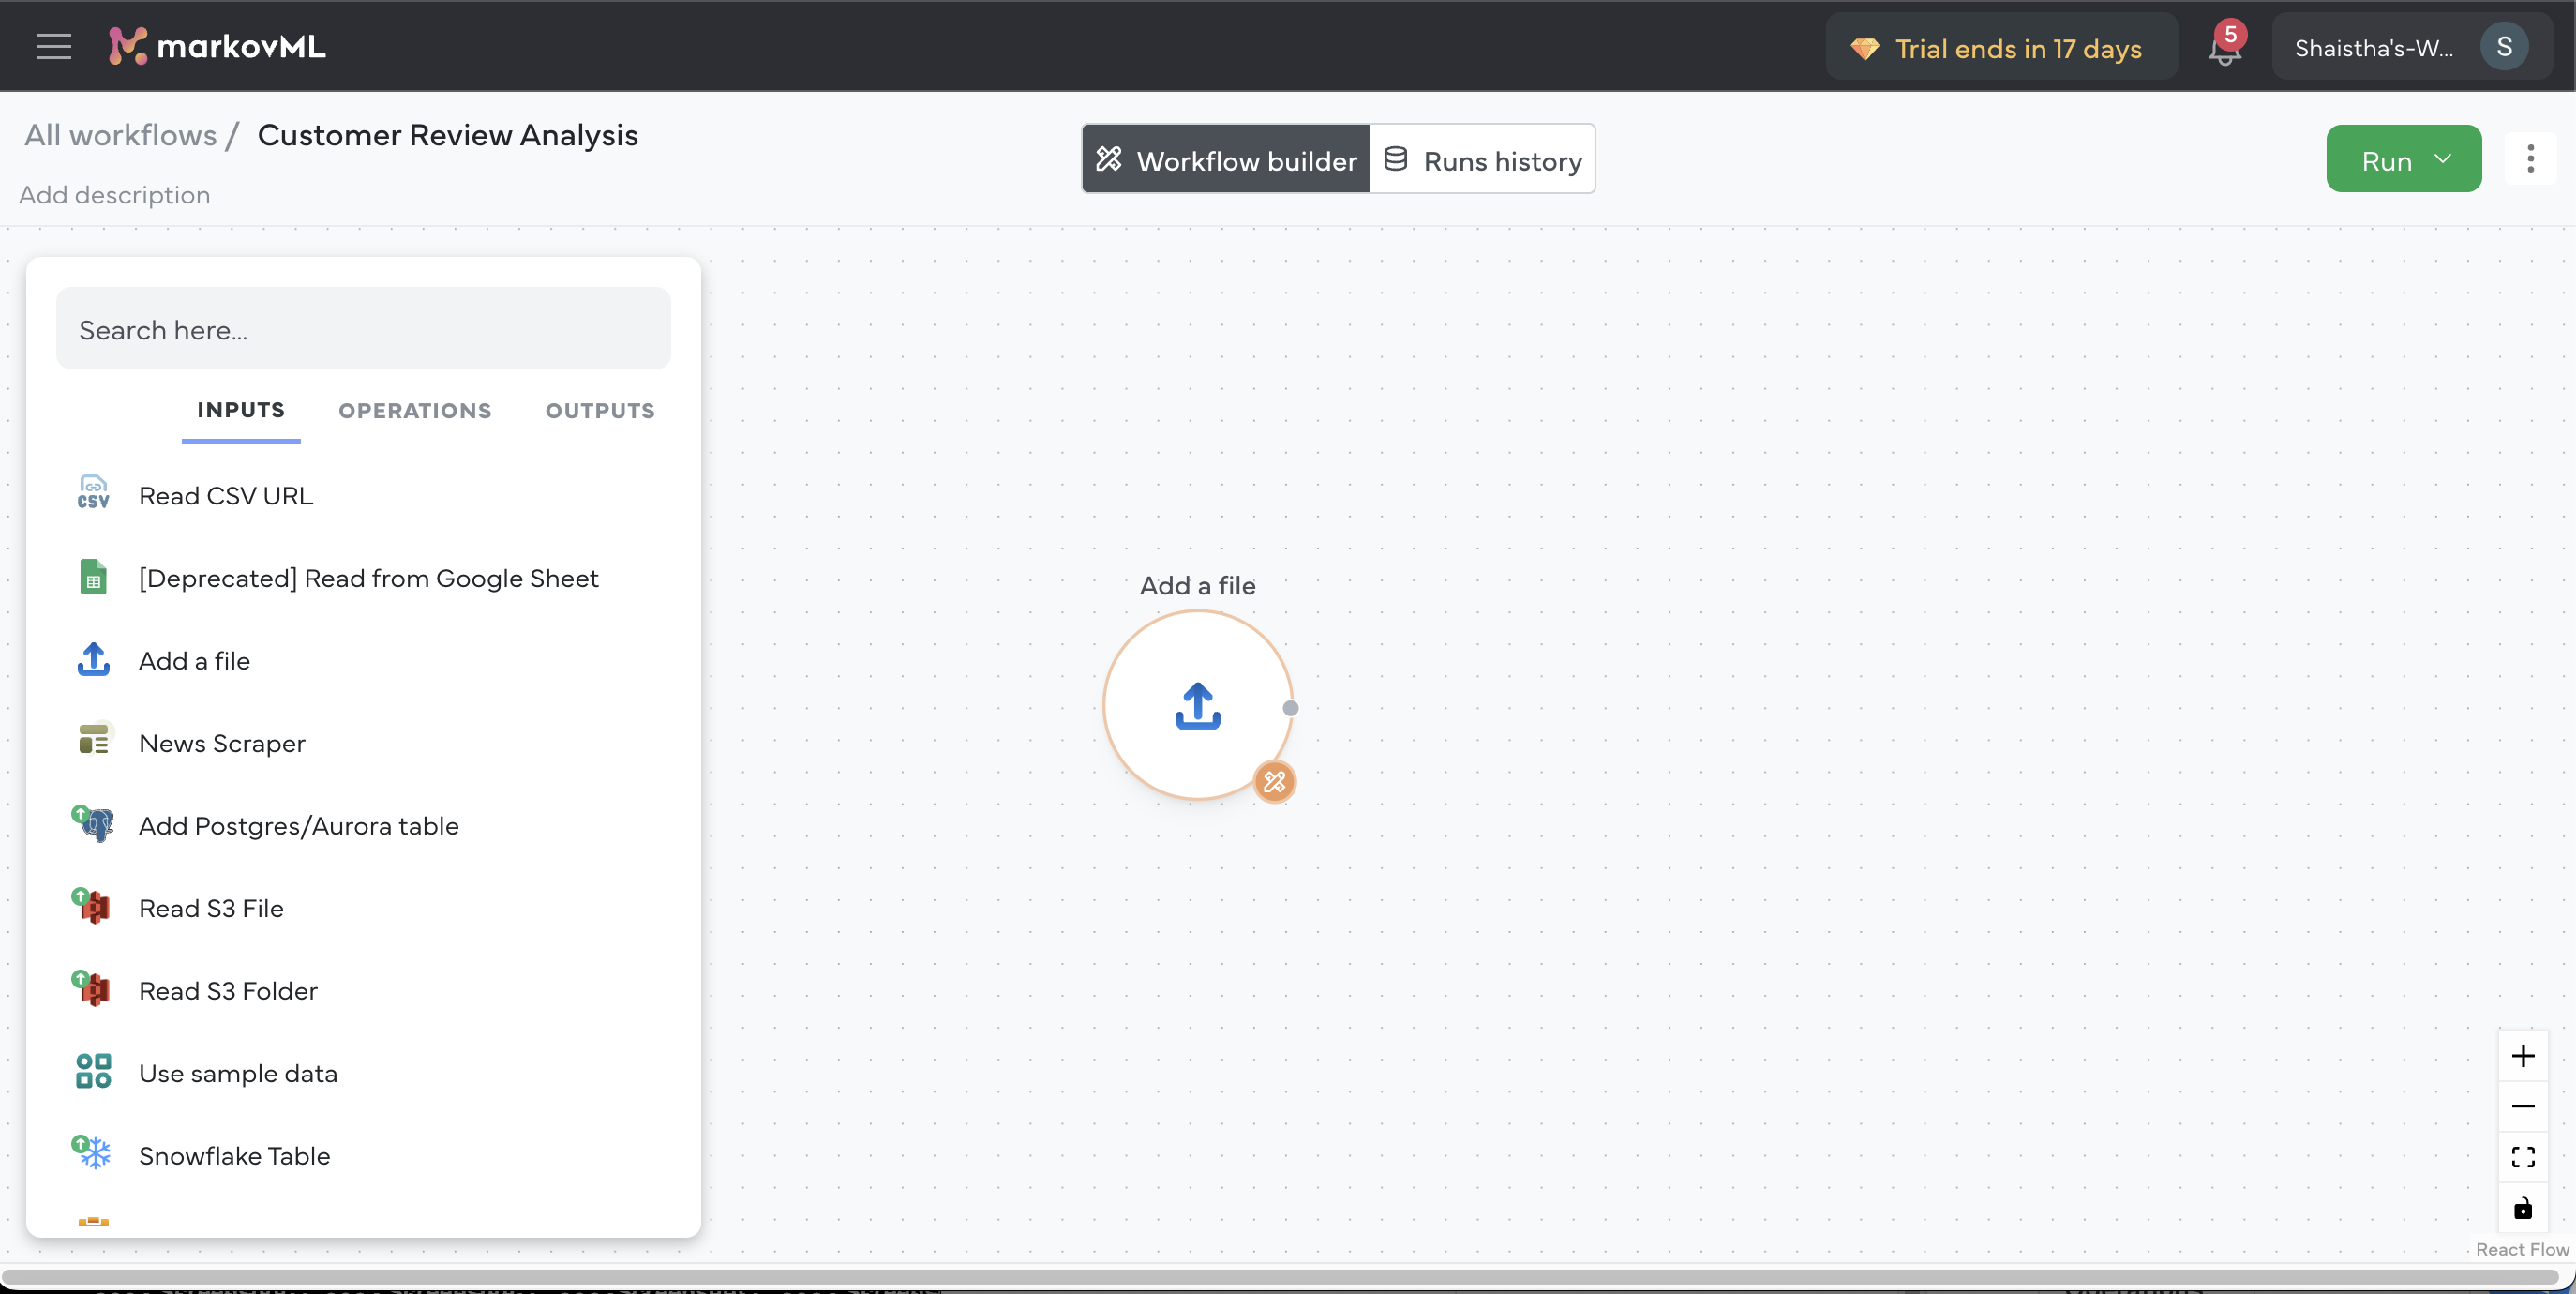
On the left floating bar, under the INPUTS section, click on Add a file.
-
This will create an input block in your workflow. Click the block (or the pen icon) to open a pop-up.
-
Upload your .csv file and preview it to make sure everything looks good.
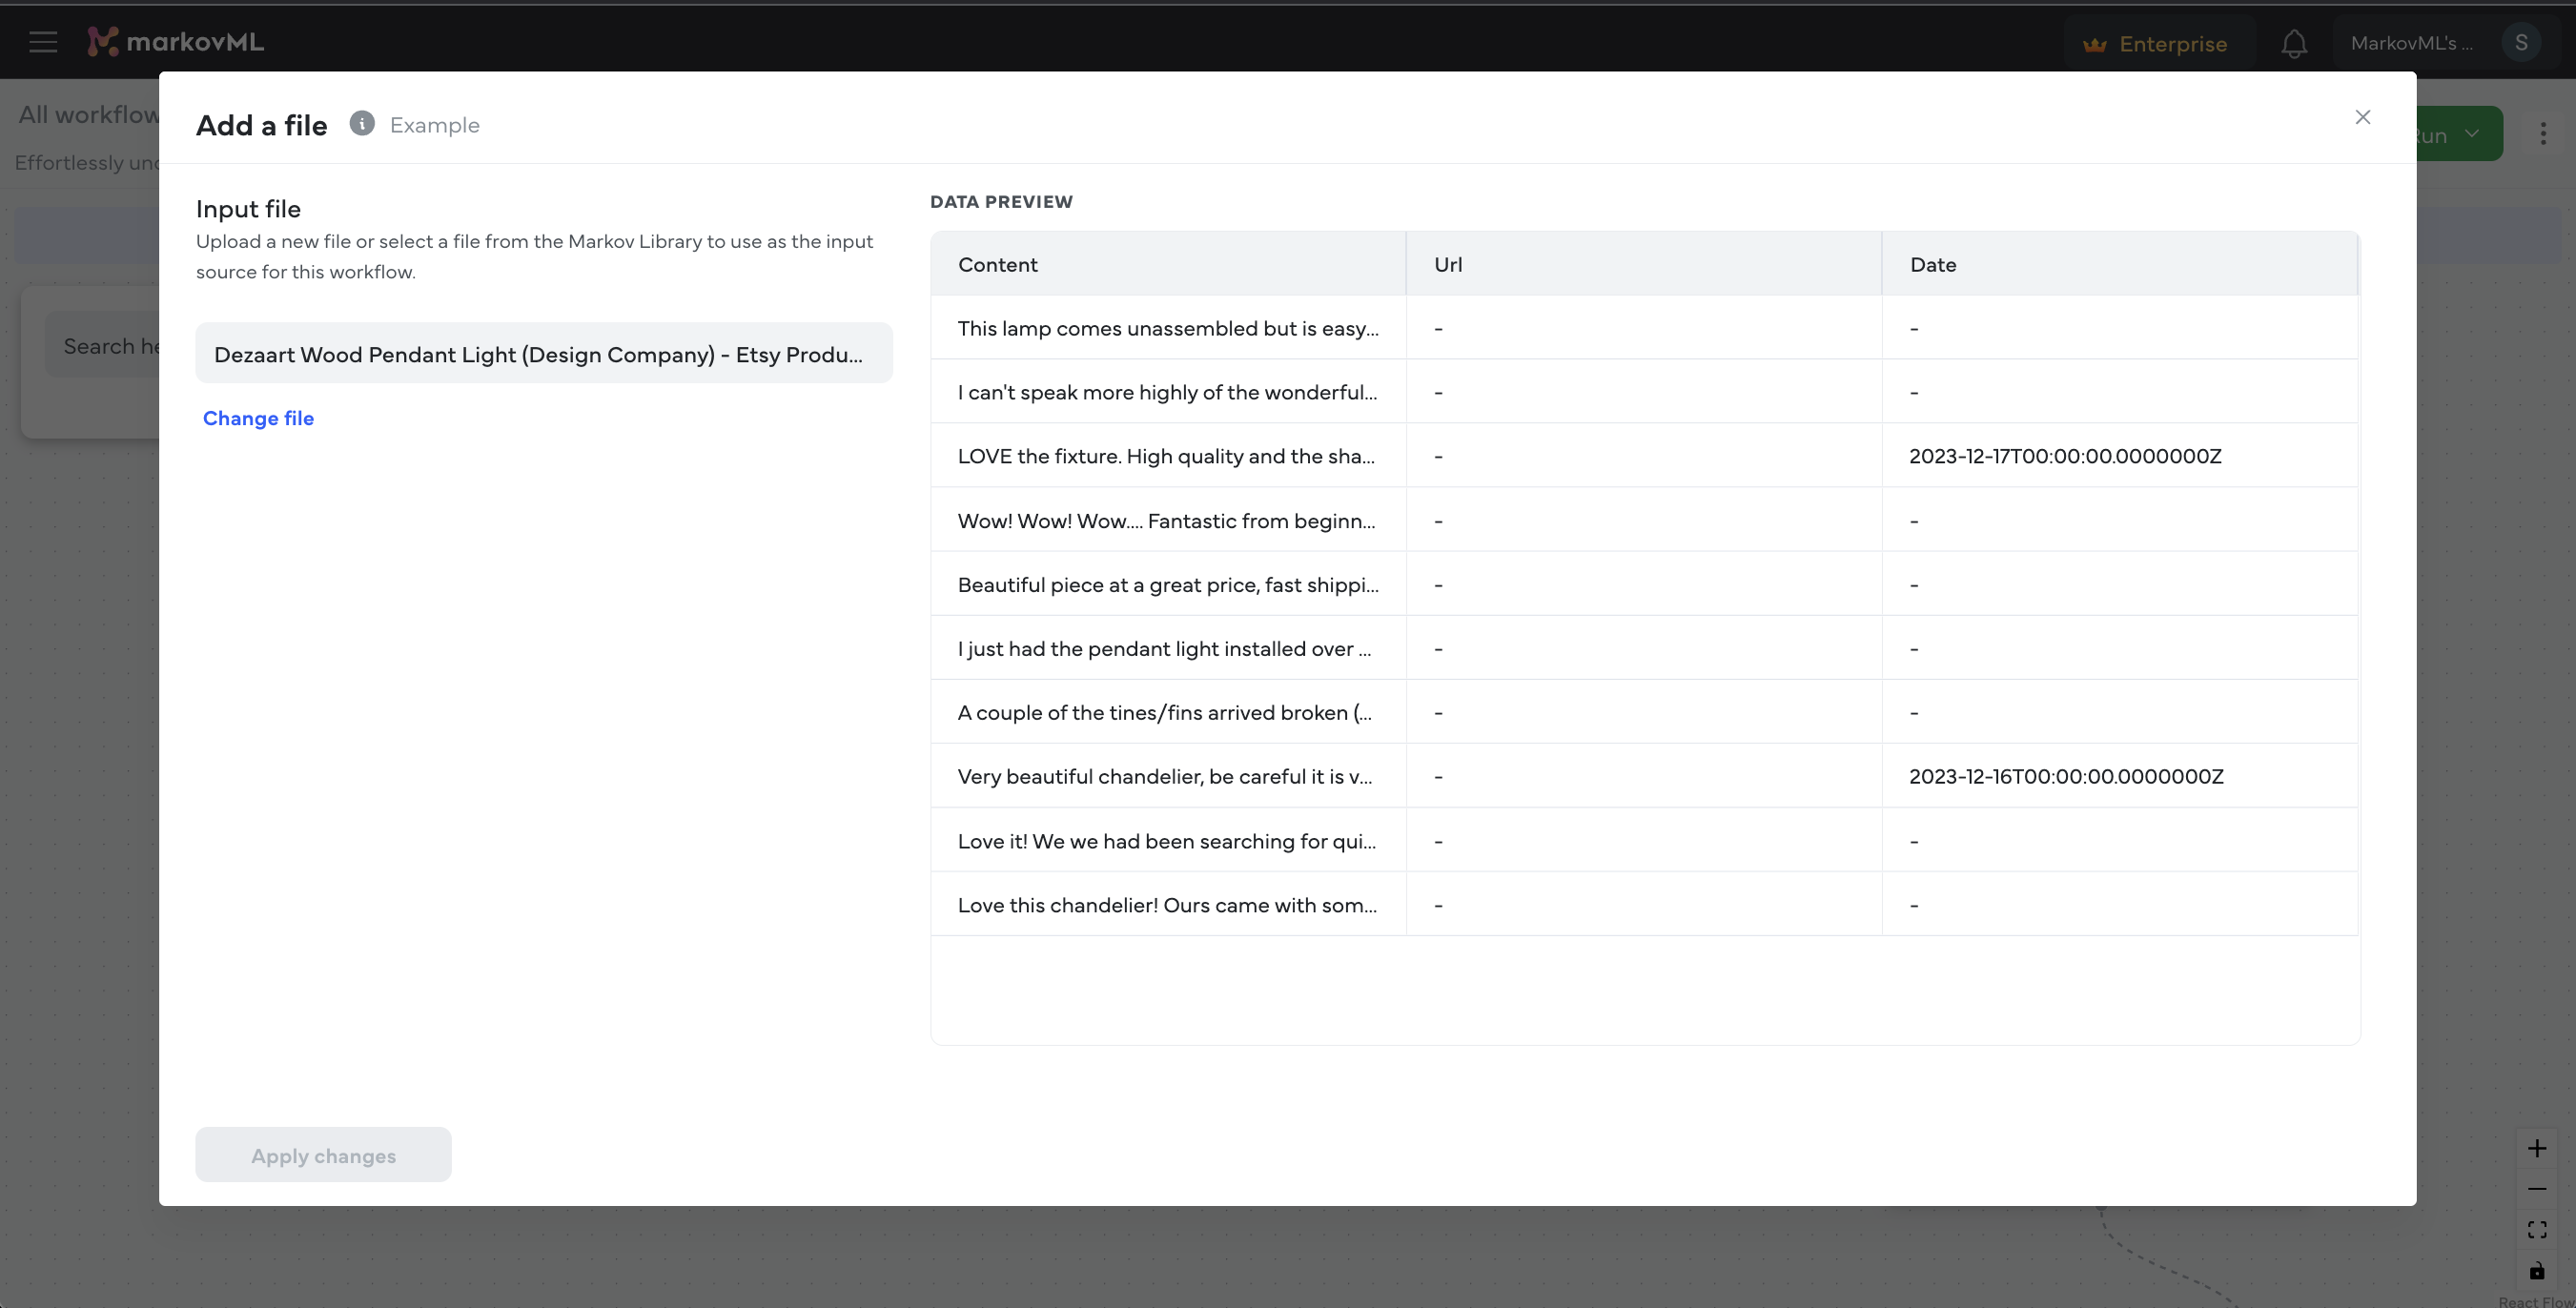
And just like that, your data is ready for processing!
Step 2: Choose the Right Operations for Analysis
Now that you have uploaded the data, it’s time to apply operations. Think of operations as tools for transforming raw data into meaningful insights.
MarkovML offers a variety of operations across different categories:
| Category | Description |
|---|---|
| Text Data Operations | A collection of processes for text-based data in tables. |
| Numeric Operations | A range of functions for numeric data in tables. |
| Table Structuring Operations | Tools for managing and organizing table data. |
| LLM Operations | A set of LLMs to perform AI-powered tasks. |
| LLM Operations | Specialized functions for training models and performing AutoML. |
| Multimedia & Document Operations | Operations for processing various document types and media formats. |
| Data Enrichment Operations | Enhance your datasets by integrating additional information and context. |
| Web Scraping Operations | Operations specifically designed to enrich business data. |
For this customer review analysis, let's focus on the below steps:
- Data preparation - Remove Extra Columns
- Run Sentiment Analysis
- Identify Main Topics
Let's call each of them an operation you will perform on the input data.
Operation 1: Remove Extra Columns
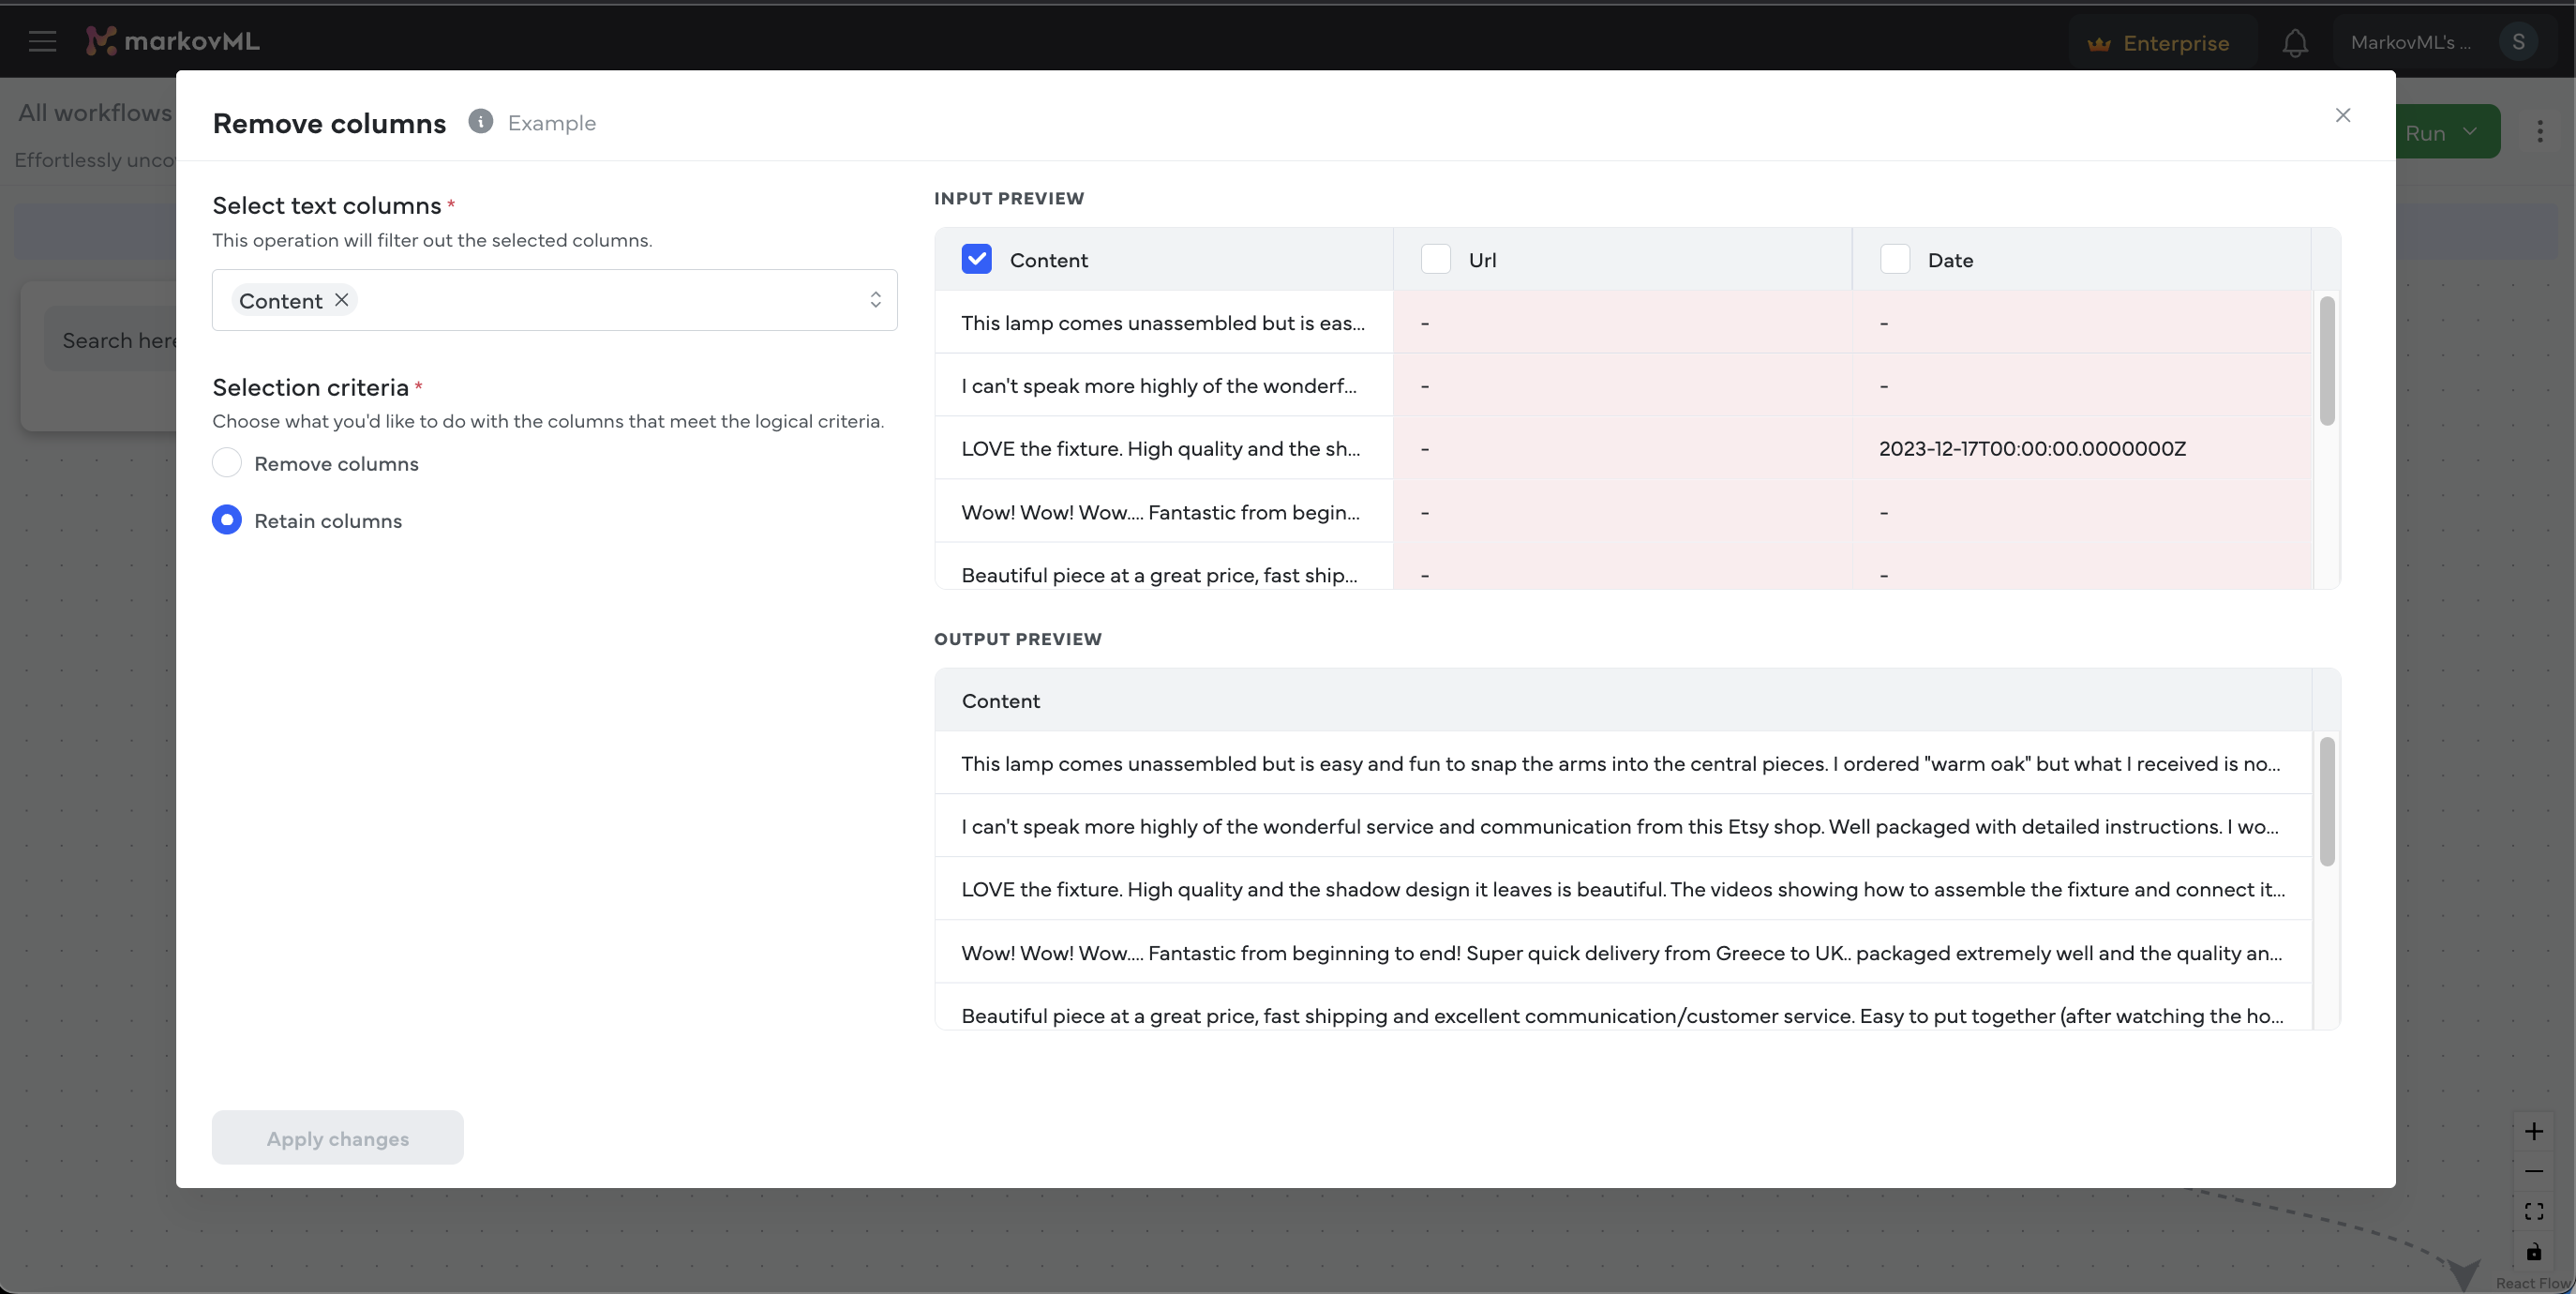
For better analysis, let's remove any unnecessary columns from the table and keep only the “content” column, which holds the review text. Follow the steps below:
-
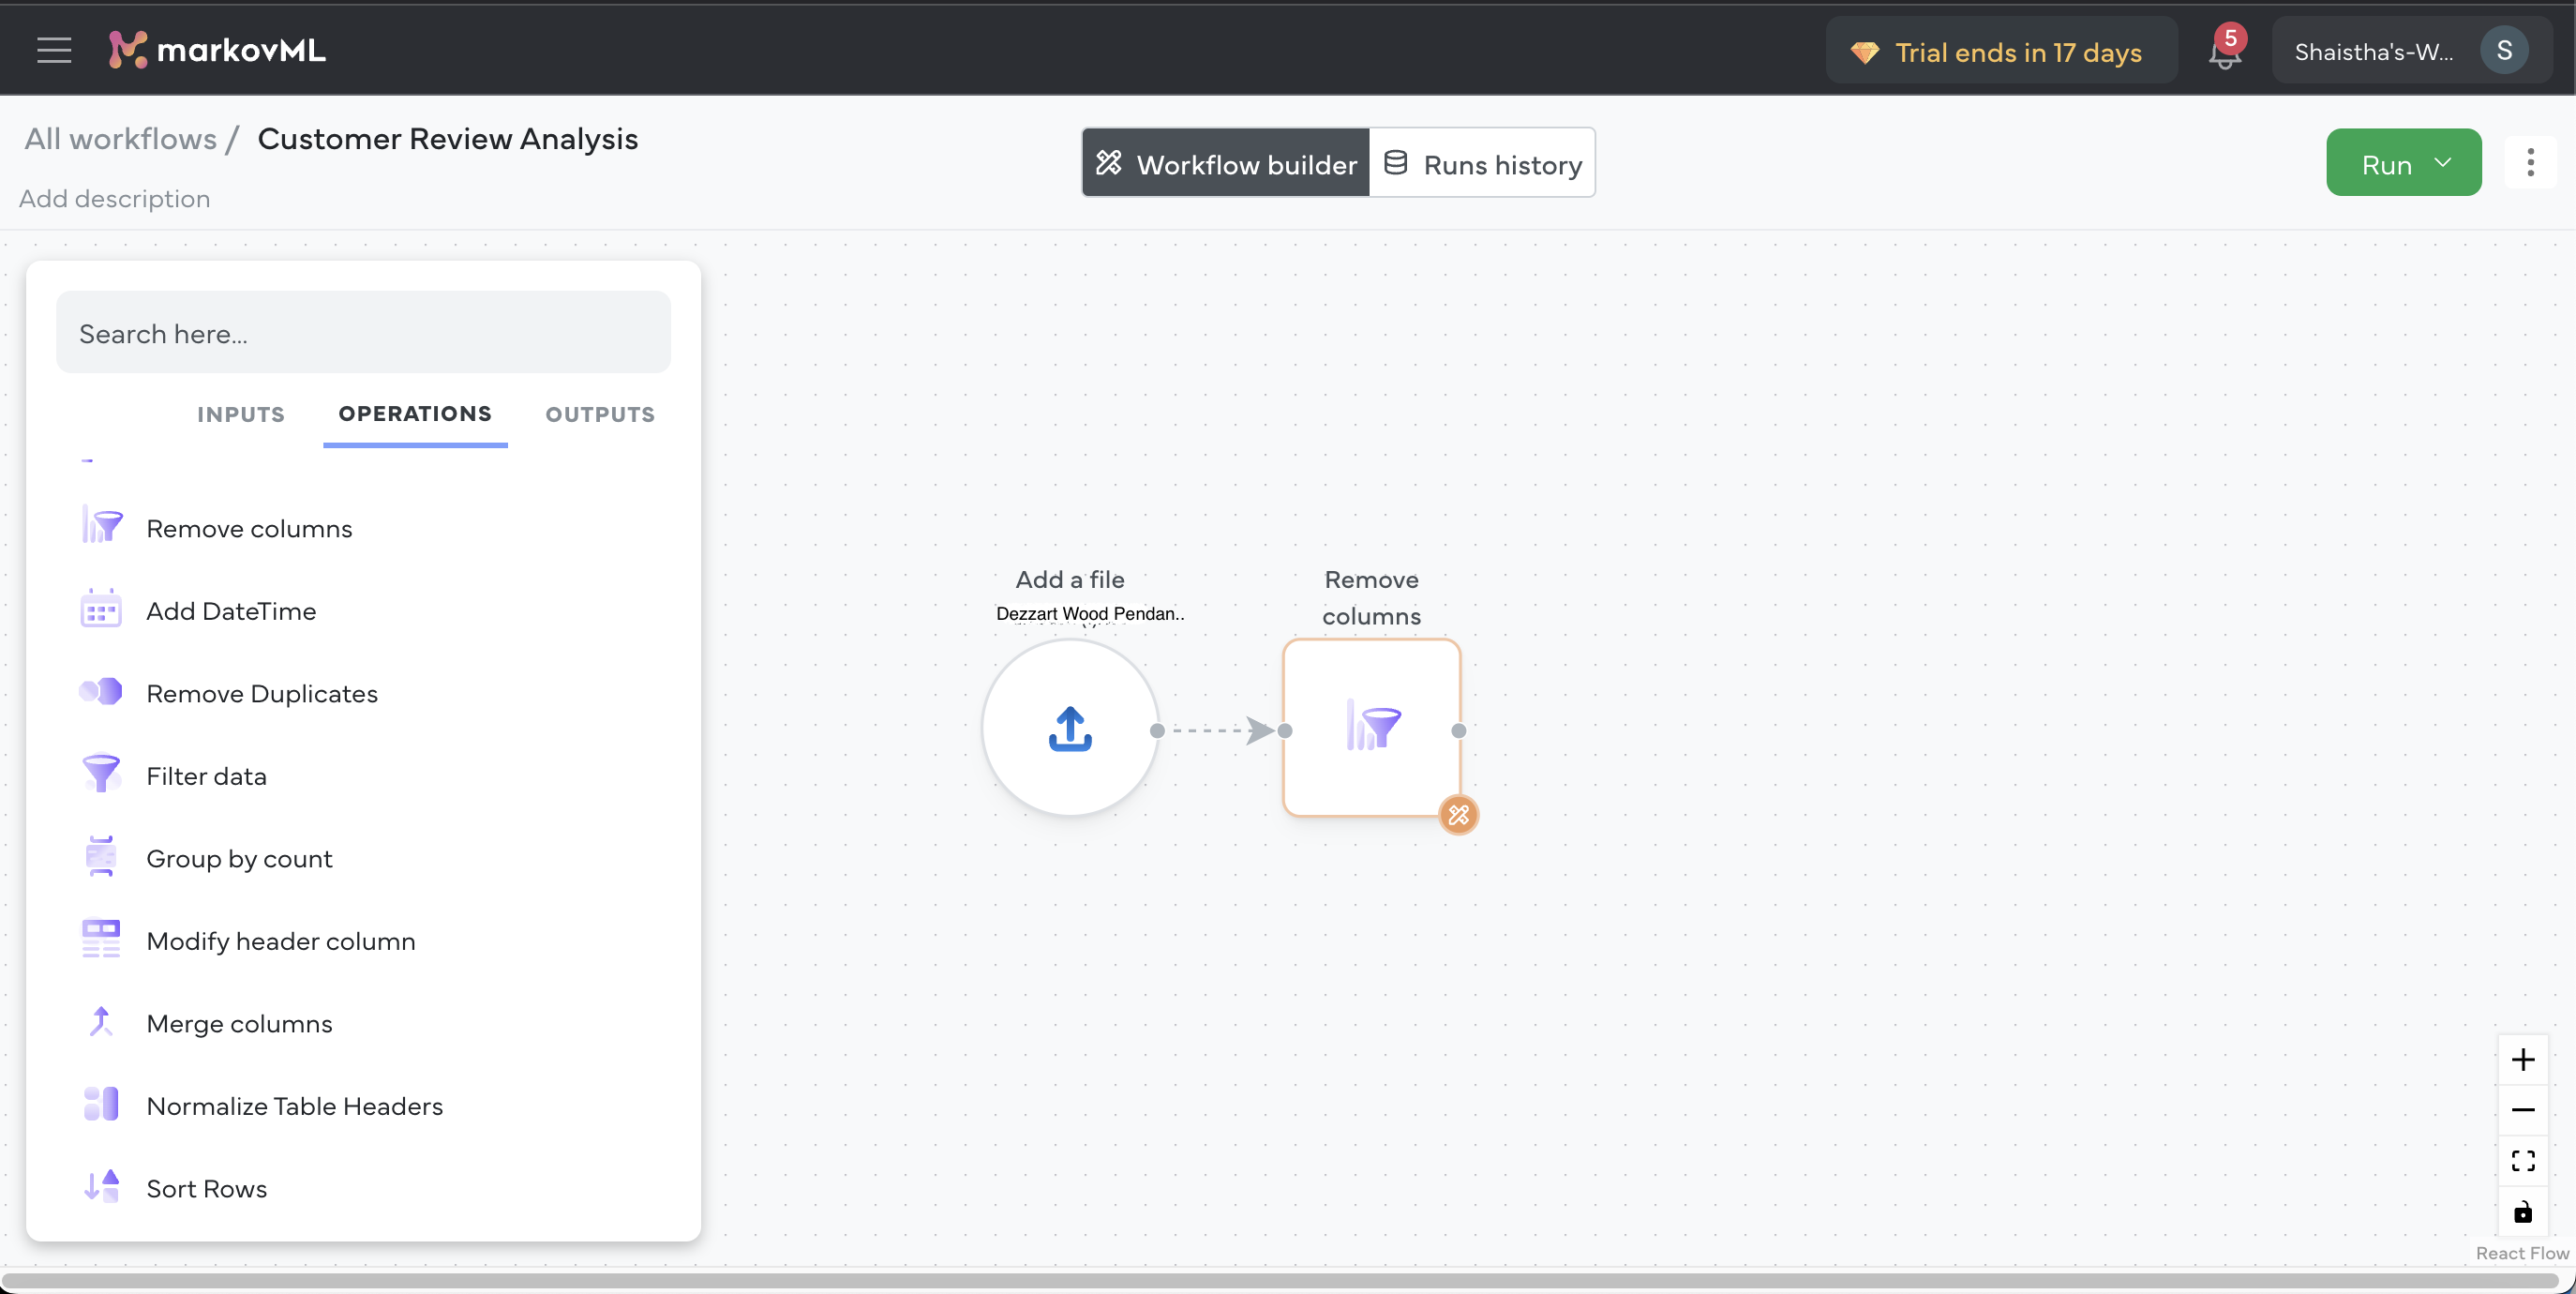
Under Table Structuring Operations, choose Remove column. This will add a "Remove column" block to the existing flow.
-
Click on the Remove column block (or the pen icon) to open its settings.
-
Select the Retain columns option, then choose “content” as the column to keep.
-
Click on the Apply changes button to preview and confirm that only the “content” column remains.
Operation 2: Perform Sentiment Analysis
Next, let’s analyze the sentiment of each review to see whether they are positive, negative, or neutral.
-
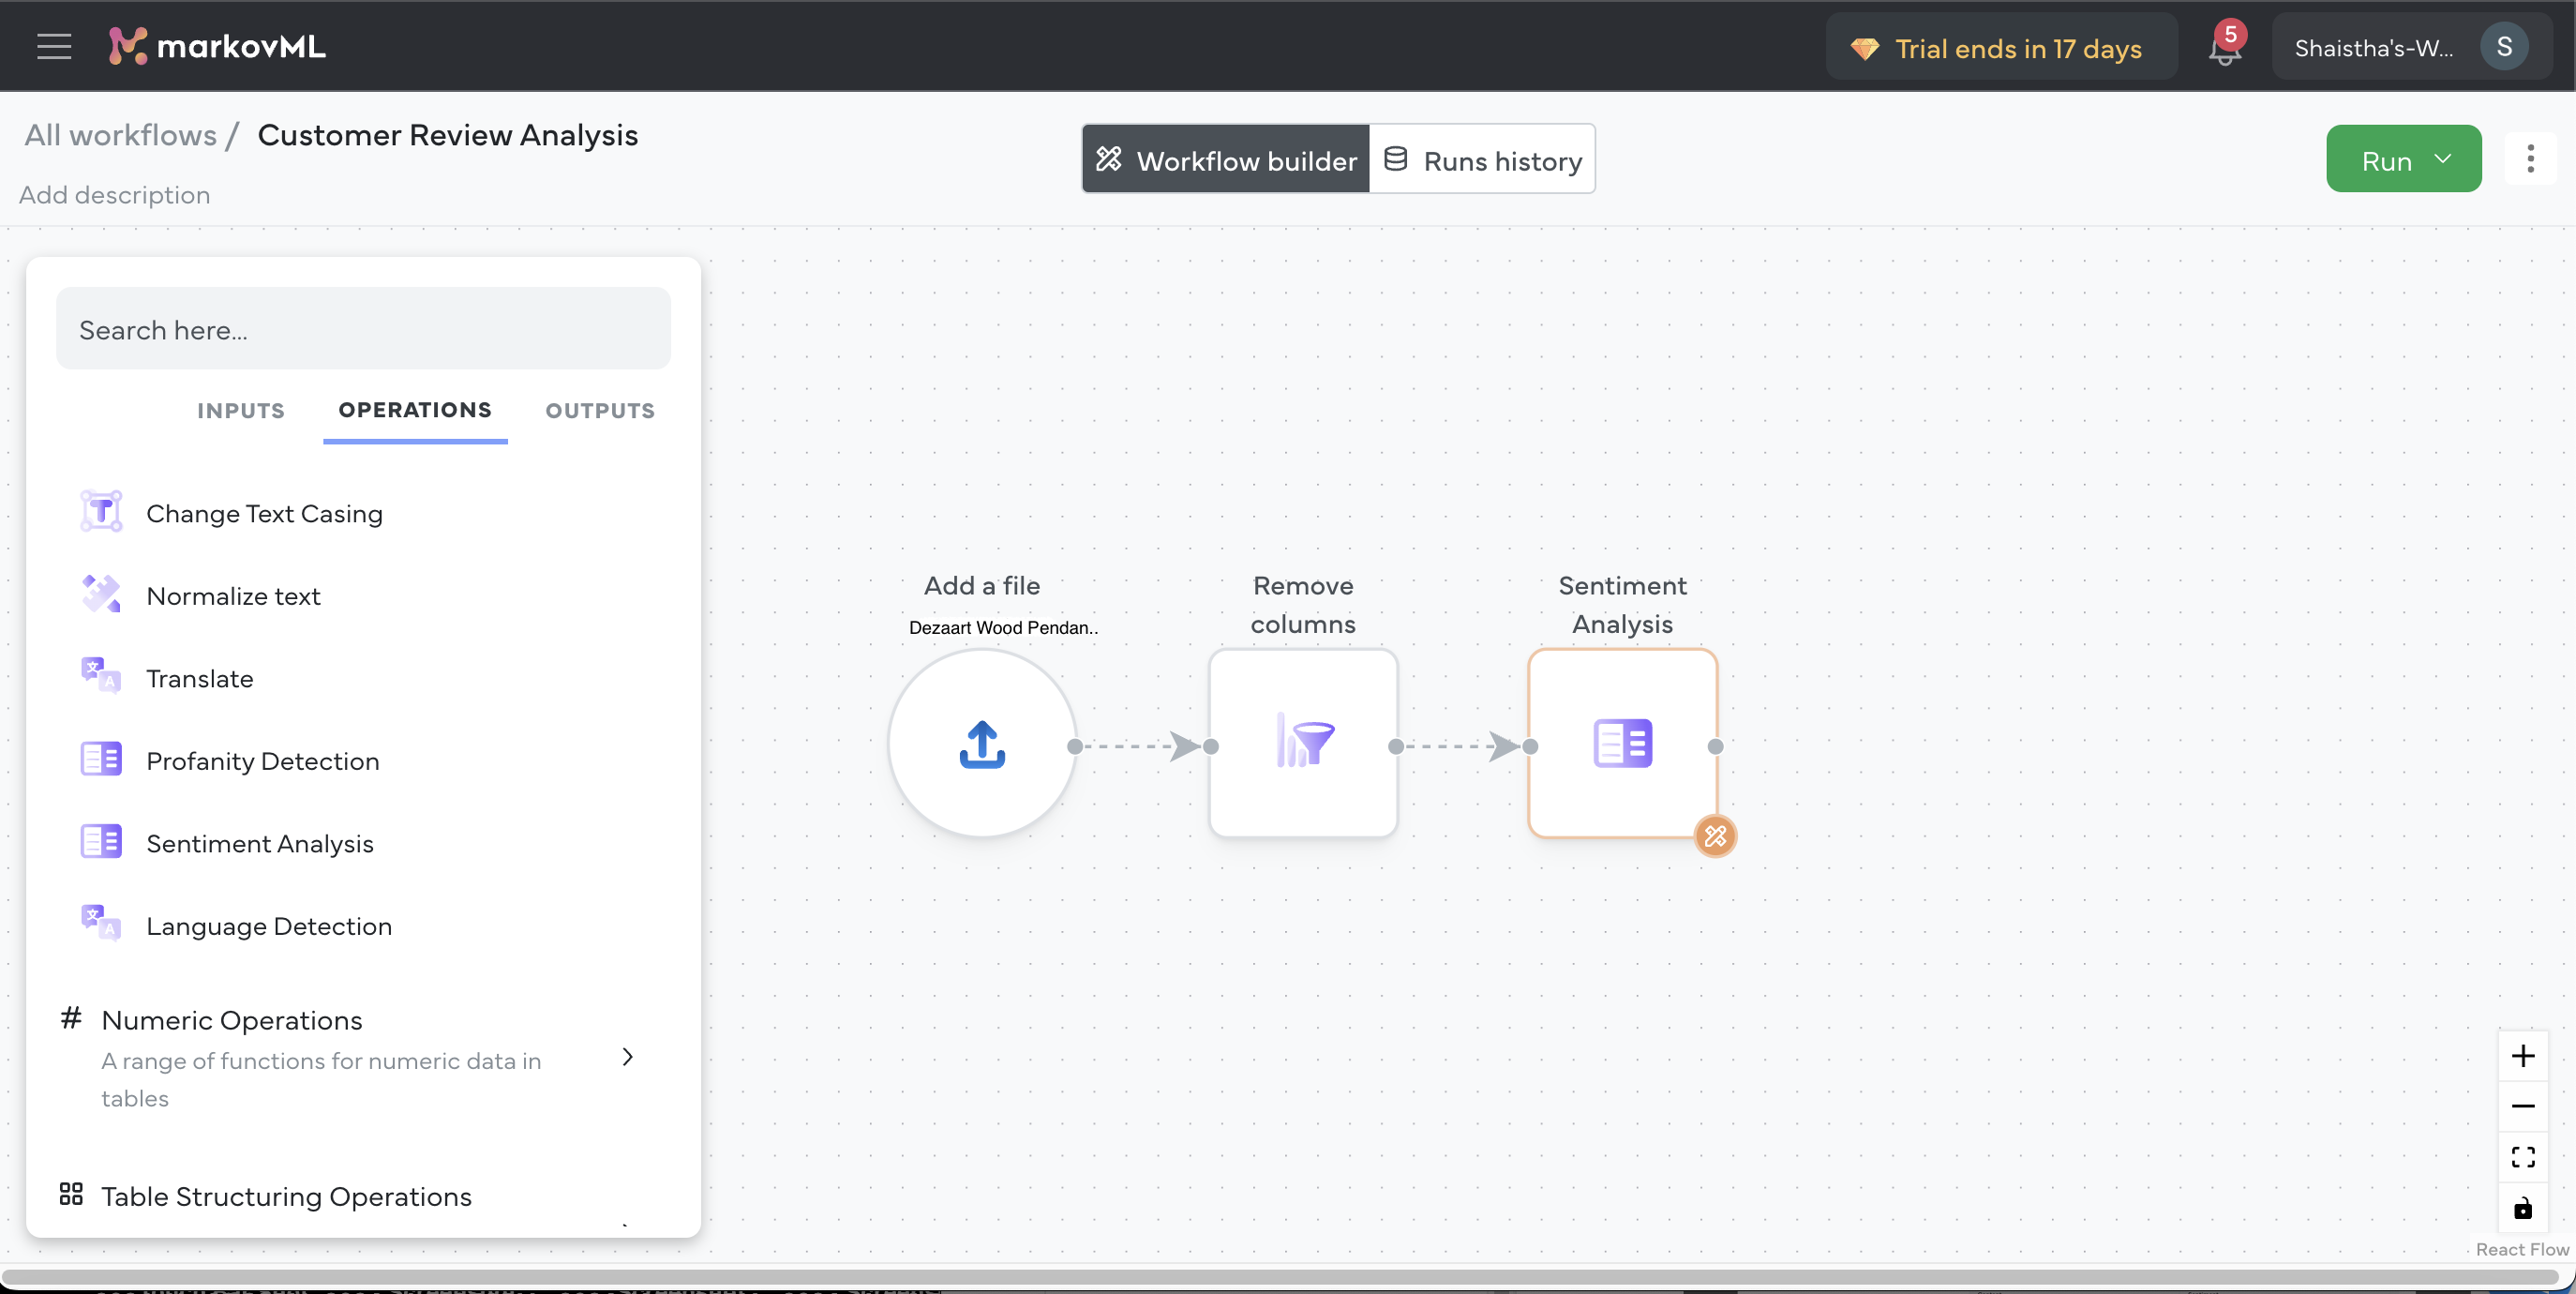
Under Text Data Operations, select Sentiment Analysis. A new block will be added to the existing flow.
-
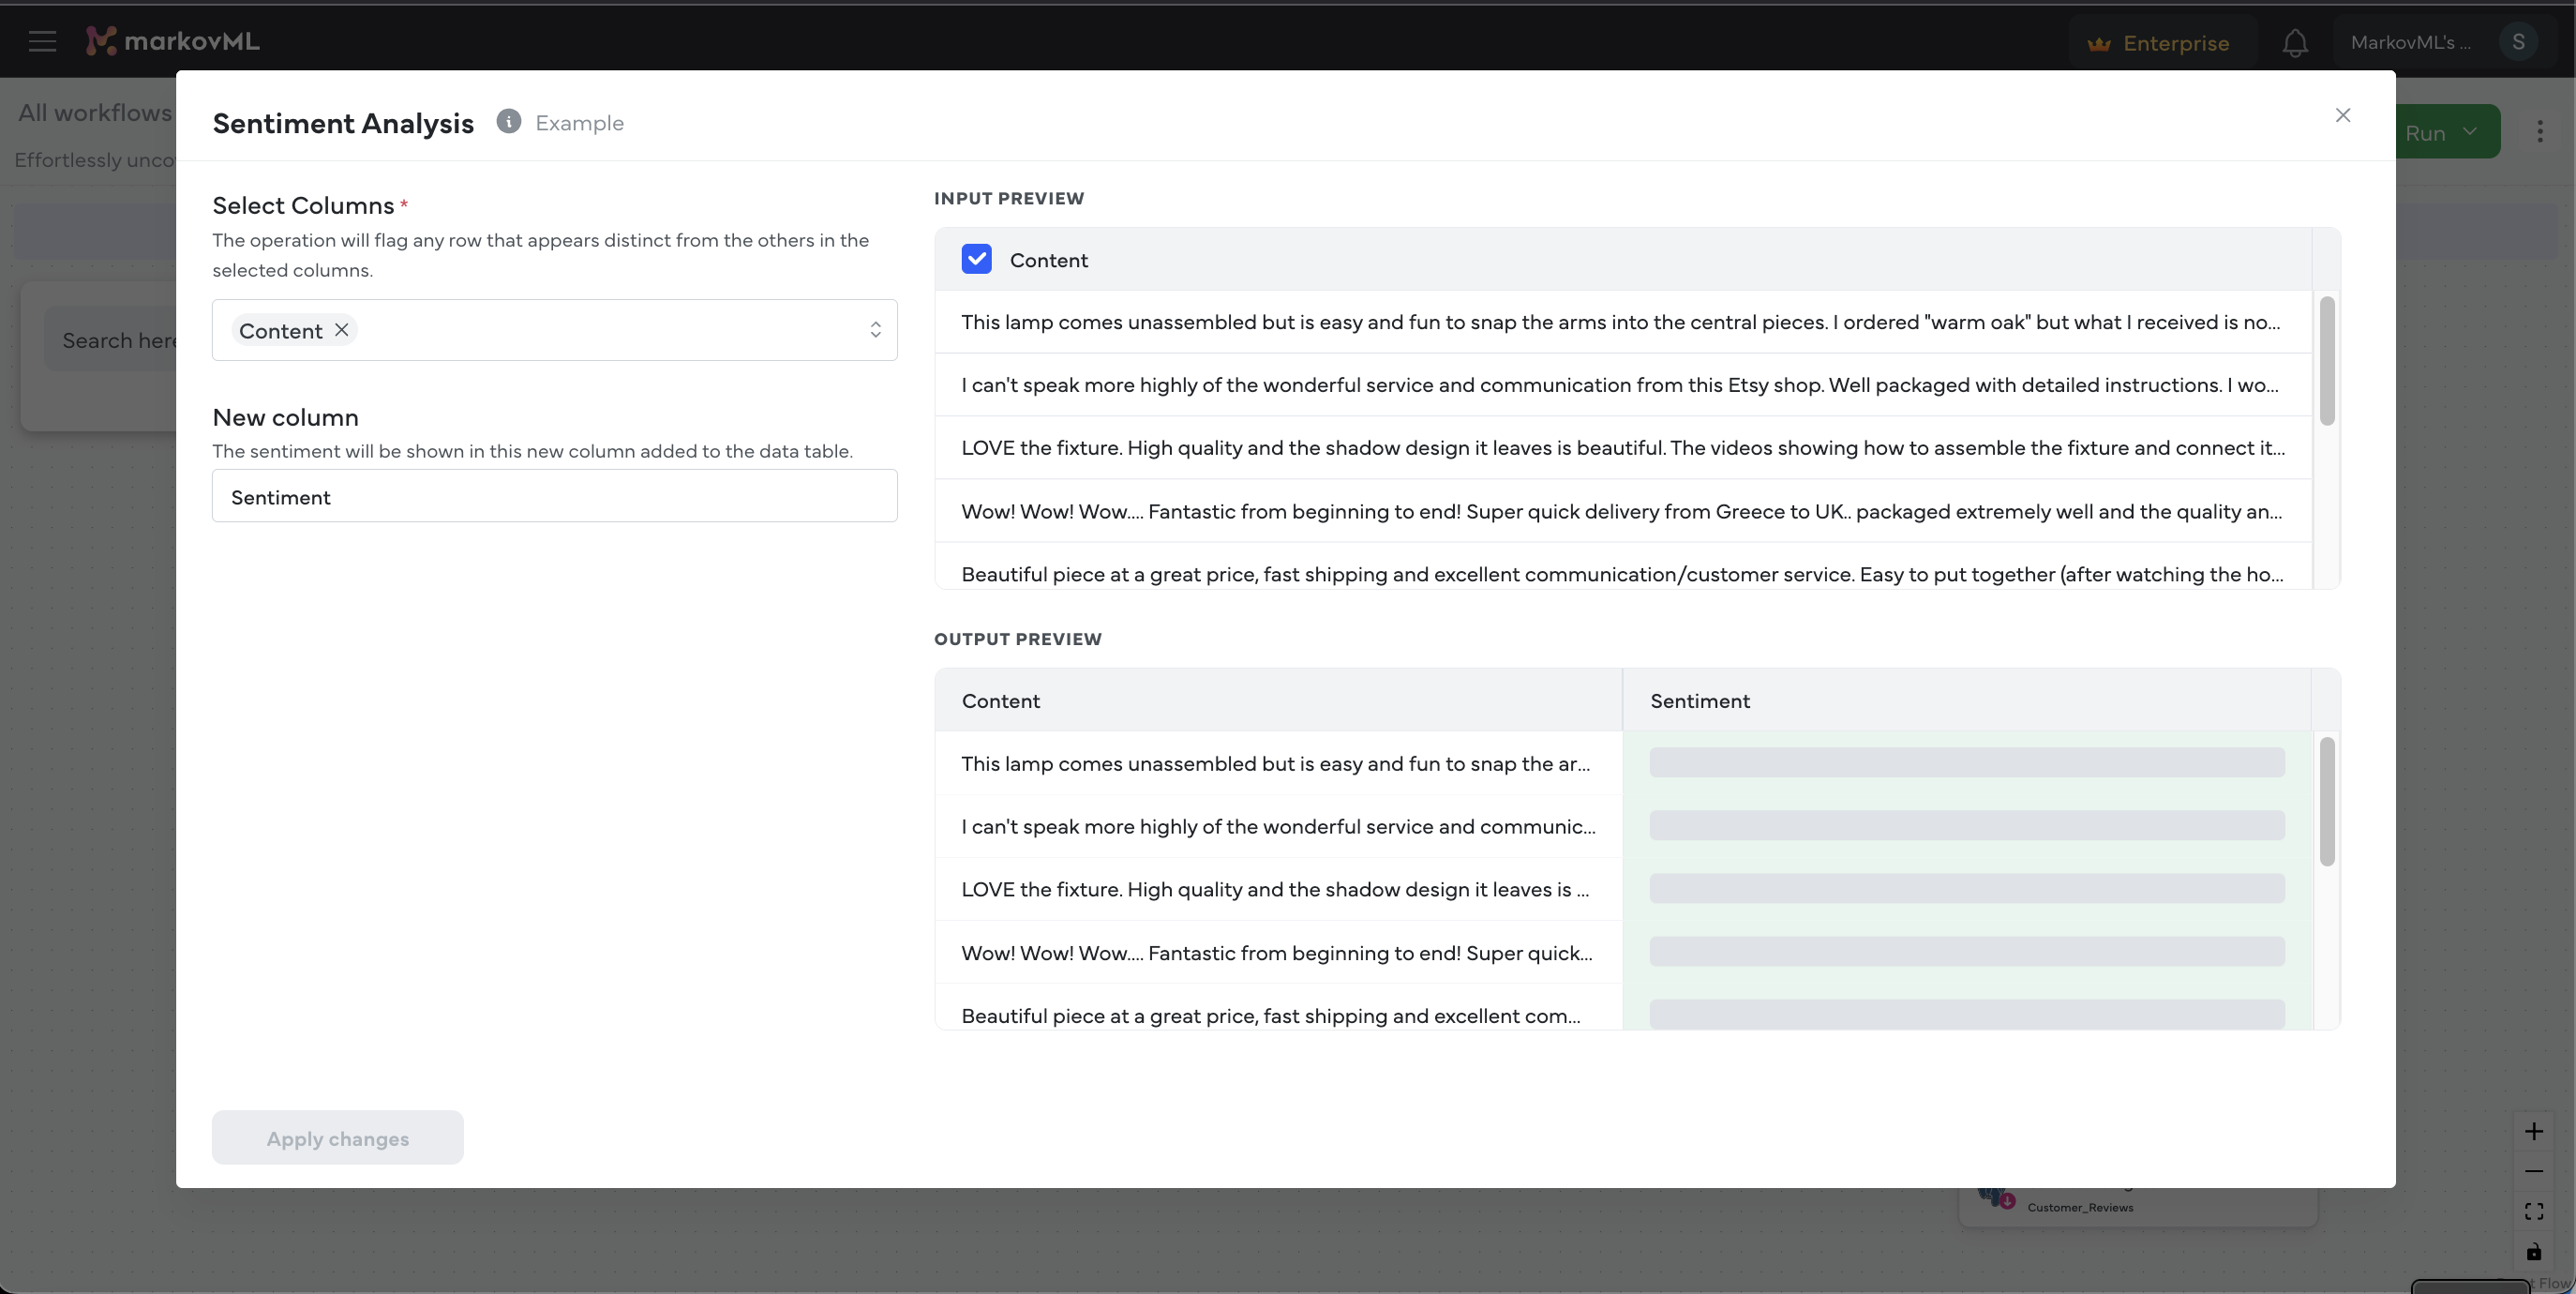
Click on Sentiment Analysis block (or the pen icon) to open its settings.
-
Set "content" as the column to analyze and set a new column name as “Sentiment,” for storing the results.
-
Click on the Apply changes button to preview the sentiment analysis results.
Operation 3: Identify Main Topics
Let’s dig deeper by identifying key topics mentioned in reviews, such as “quality,” “price,” or “customer service.”
-
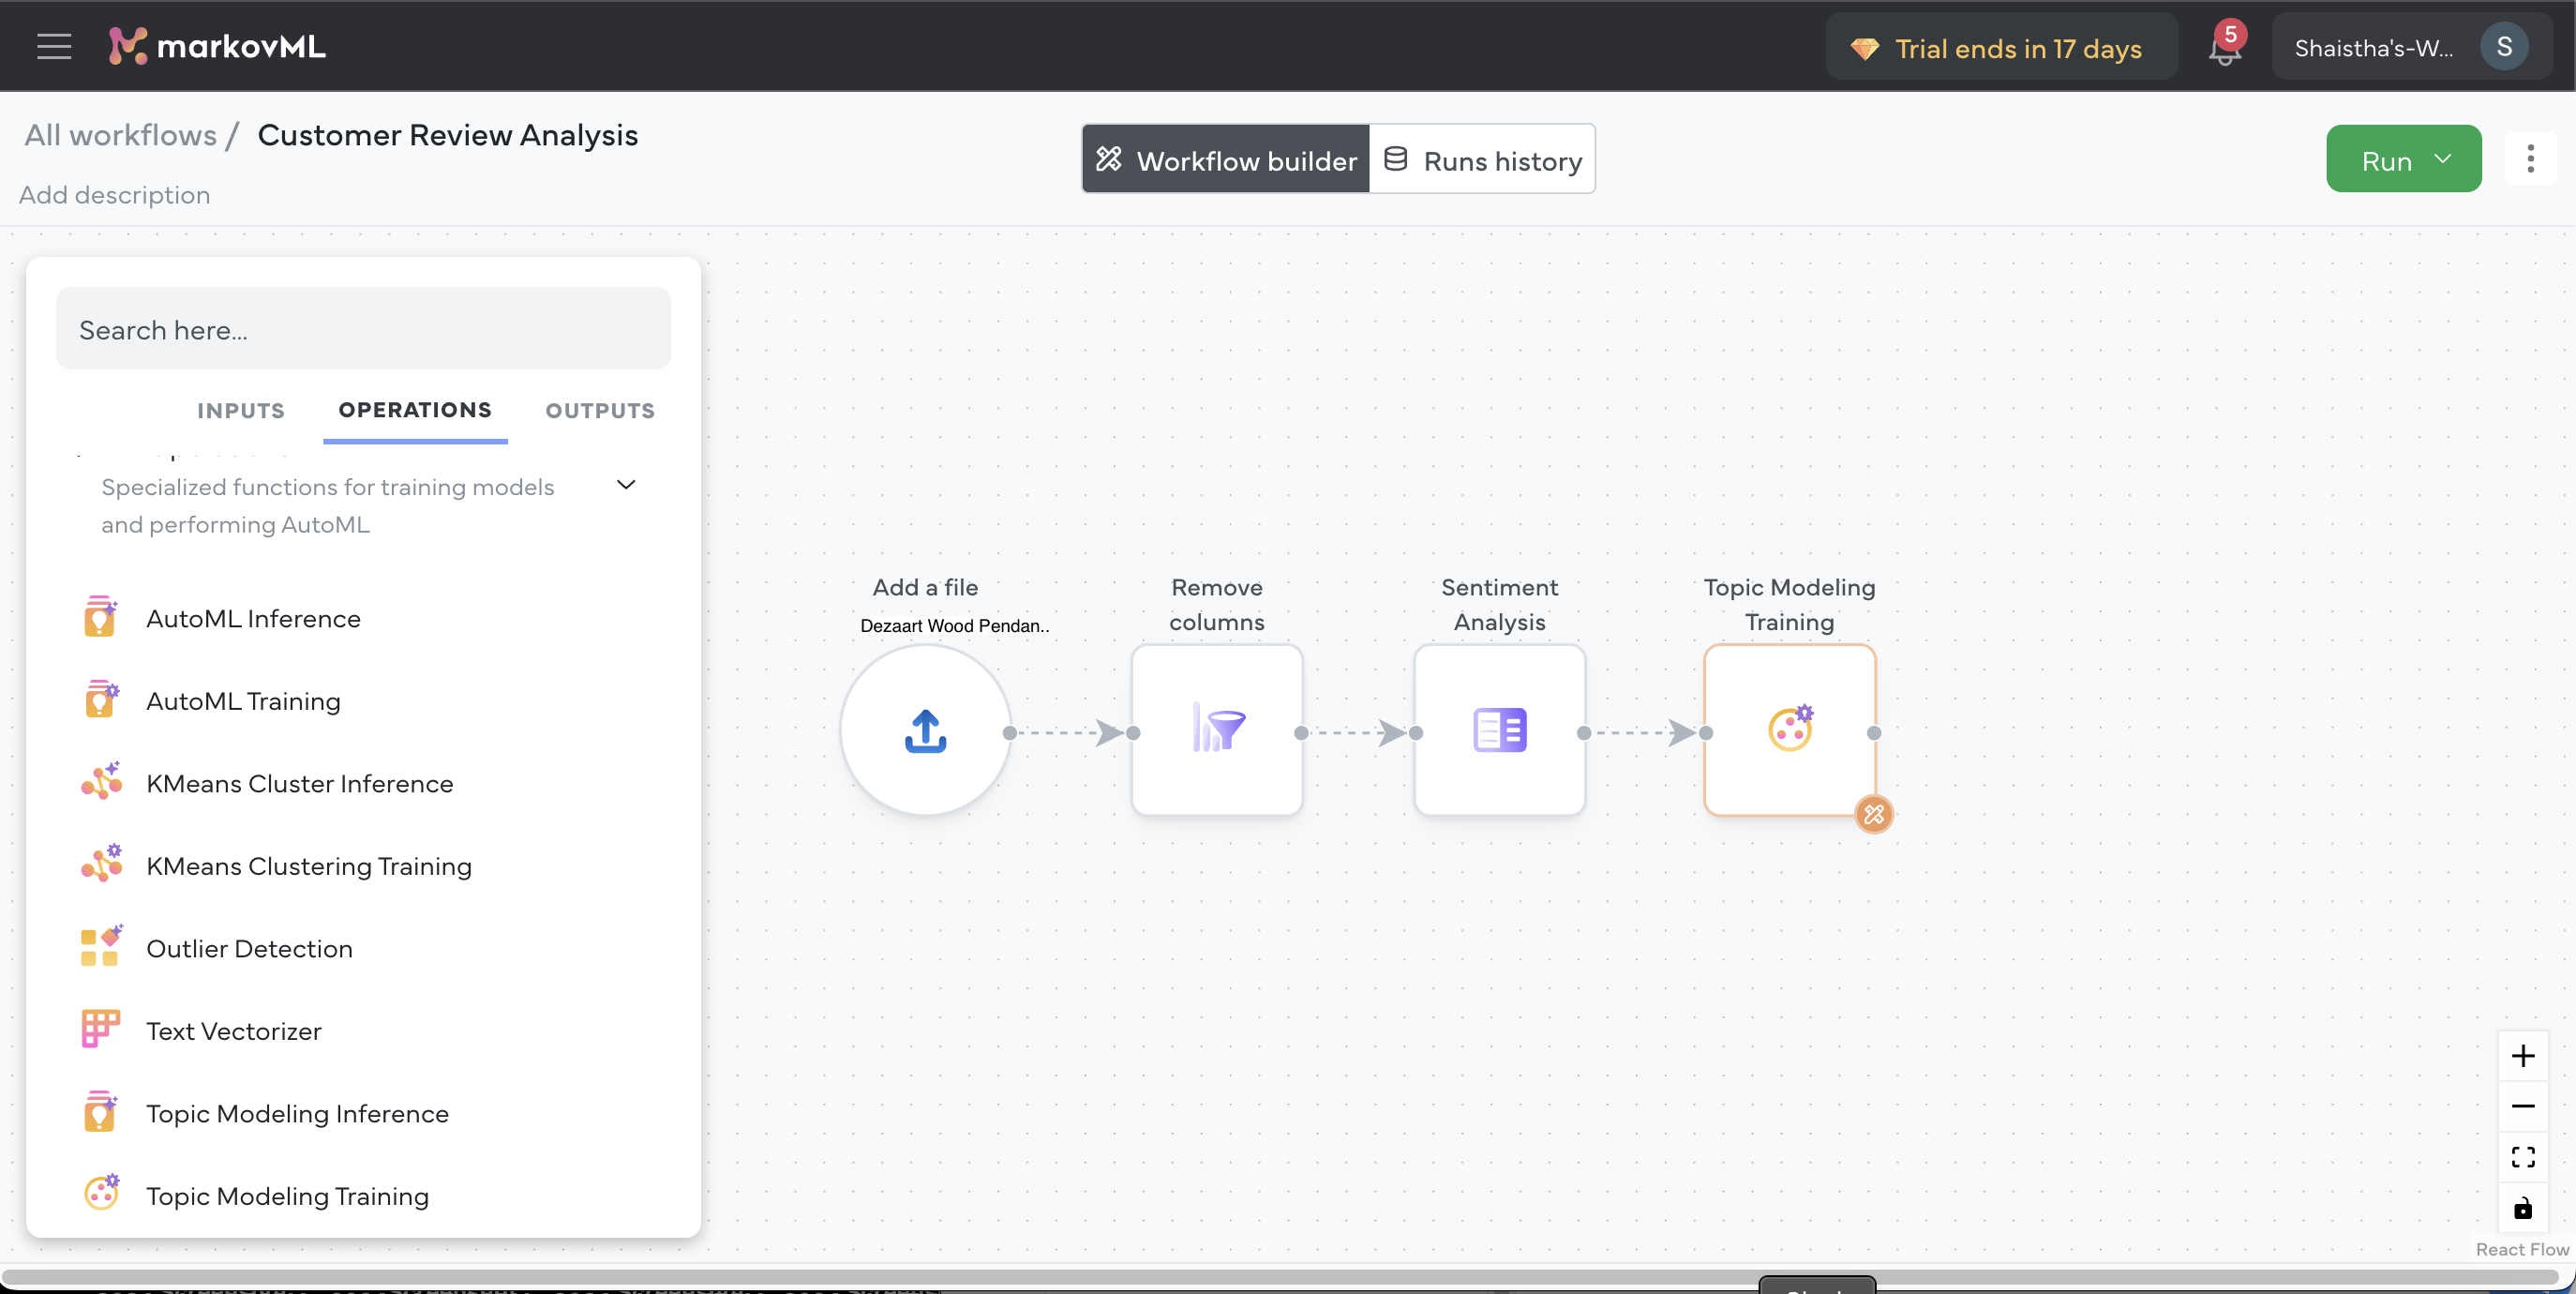
Under ML Operations, select Topic Modeling Training. This should add it to the existing flow.
-
Click on it to open the settings, and set "content" as the feature column.
-
Click on the Apply changes button to preview the results.
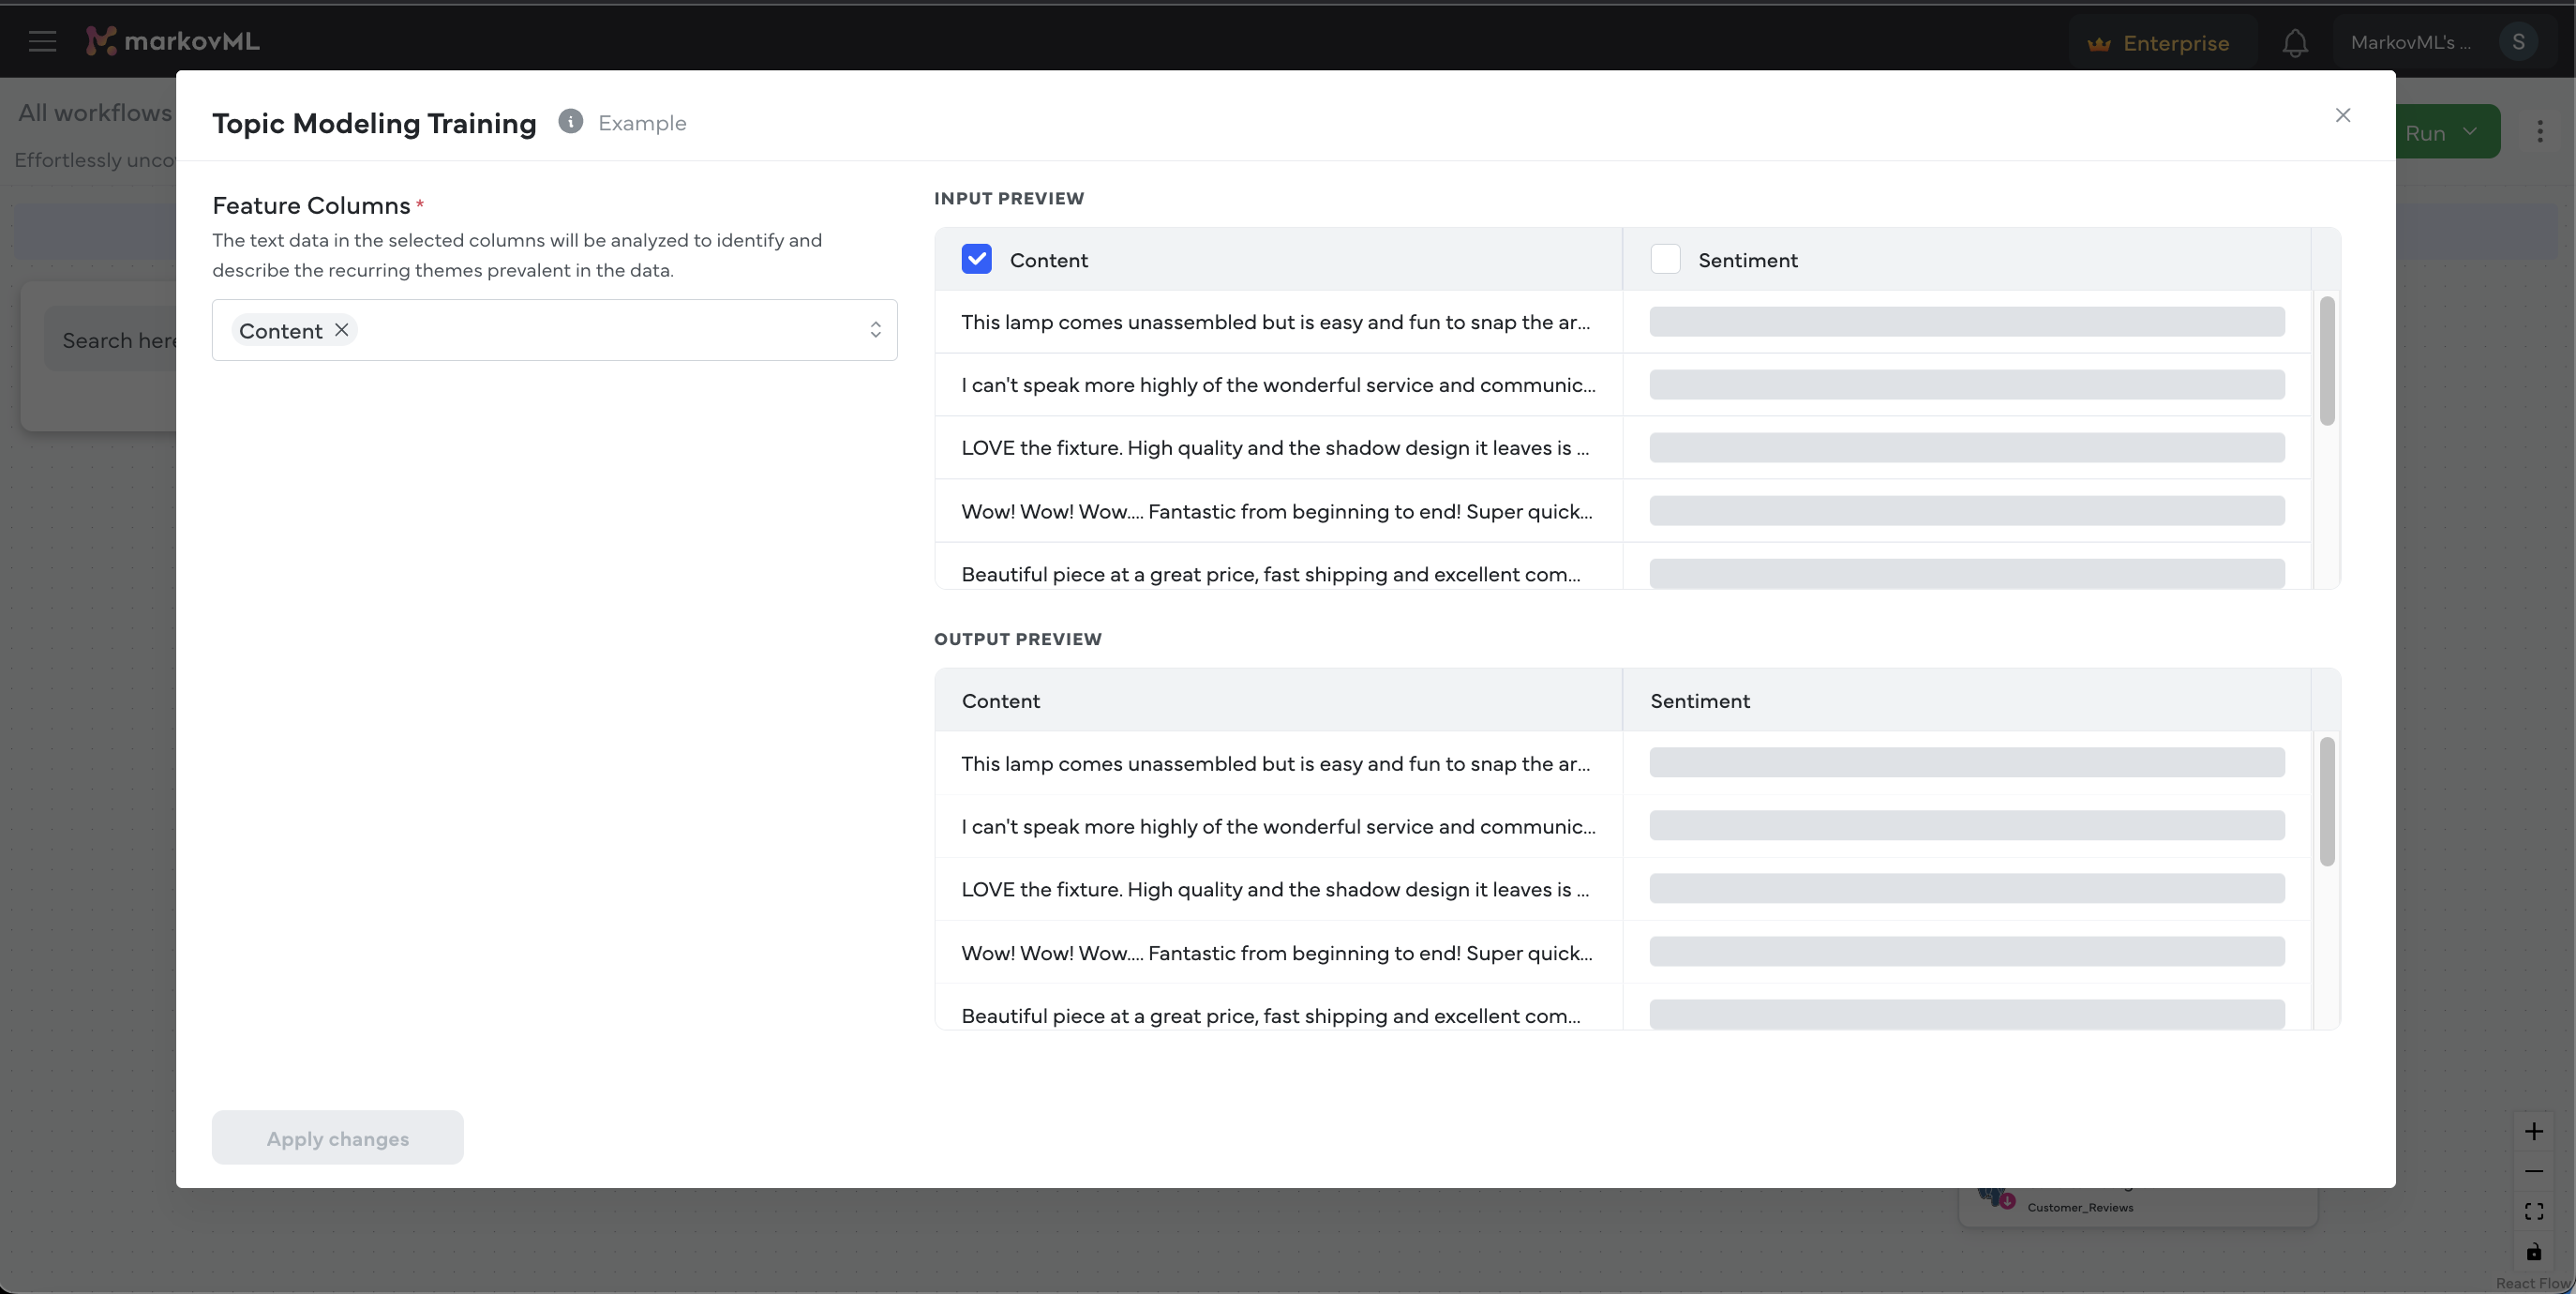
Now that you have trained the topic model, let’s apply it to automatically detect specific topics in the reviews.
-
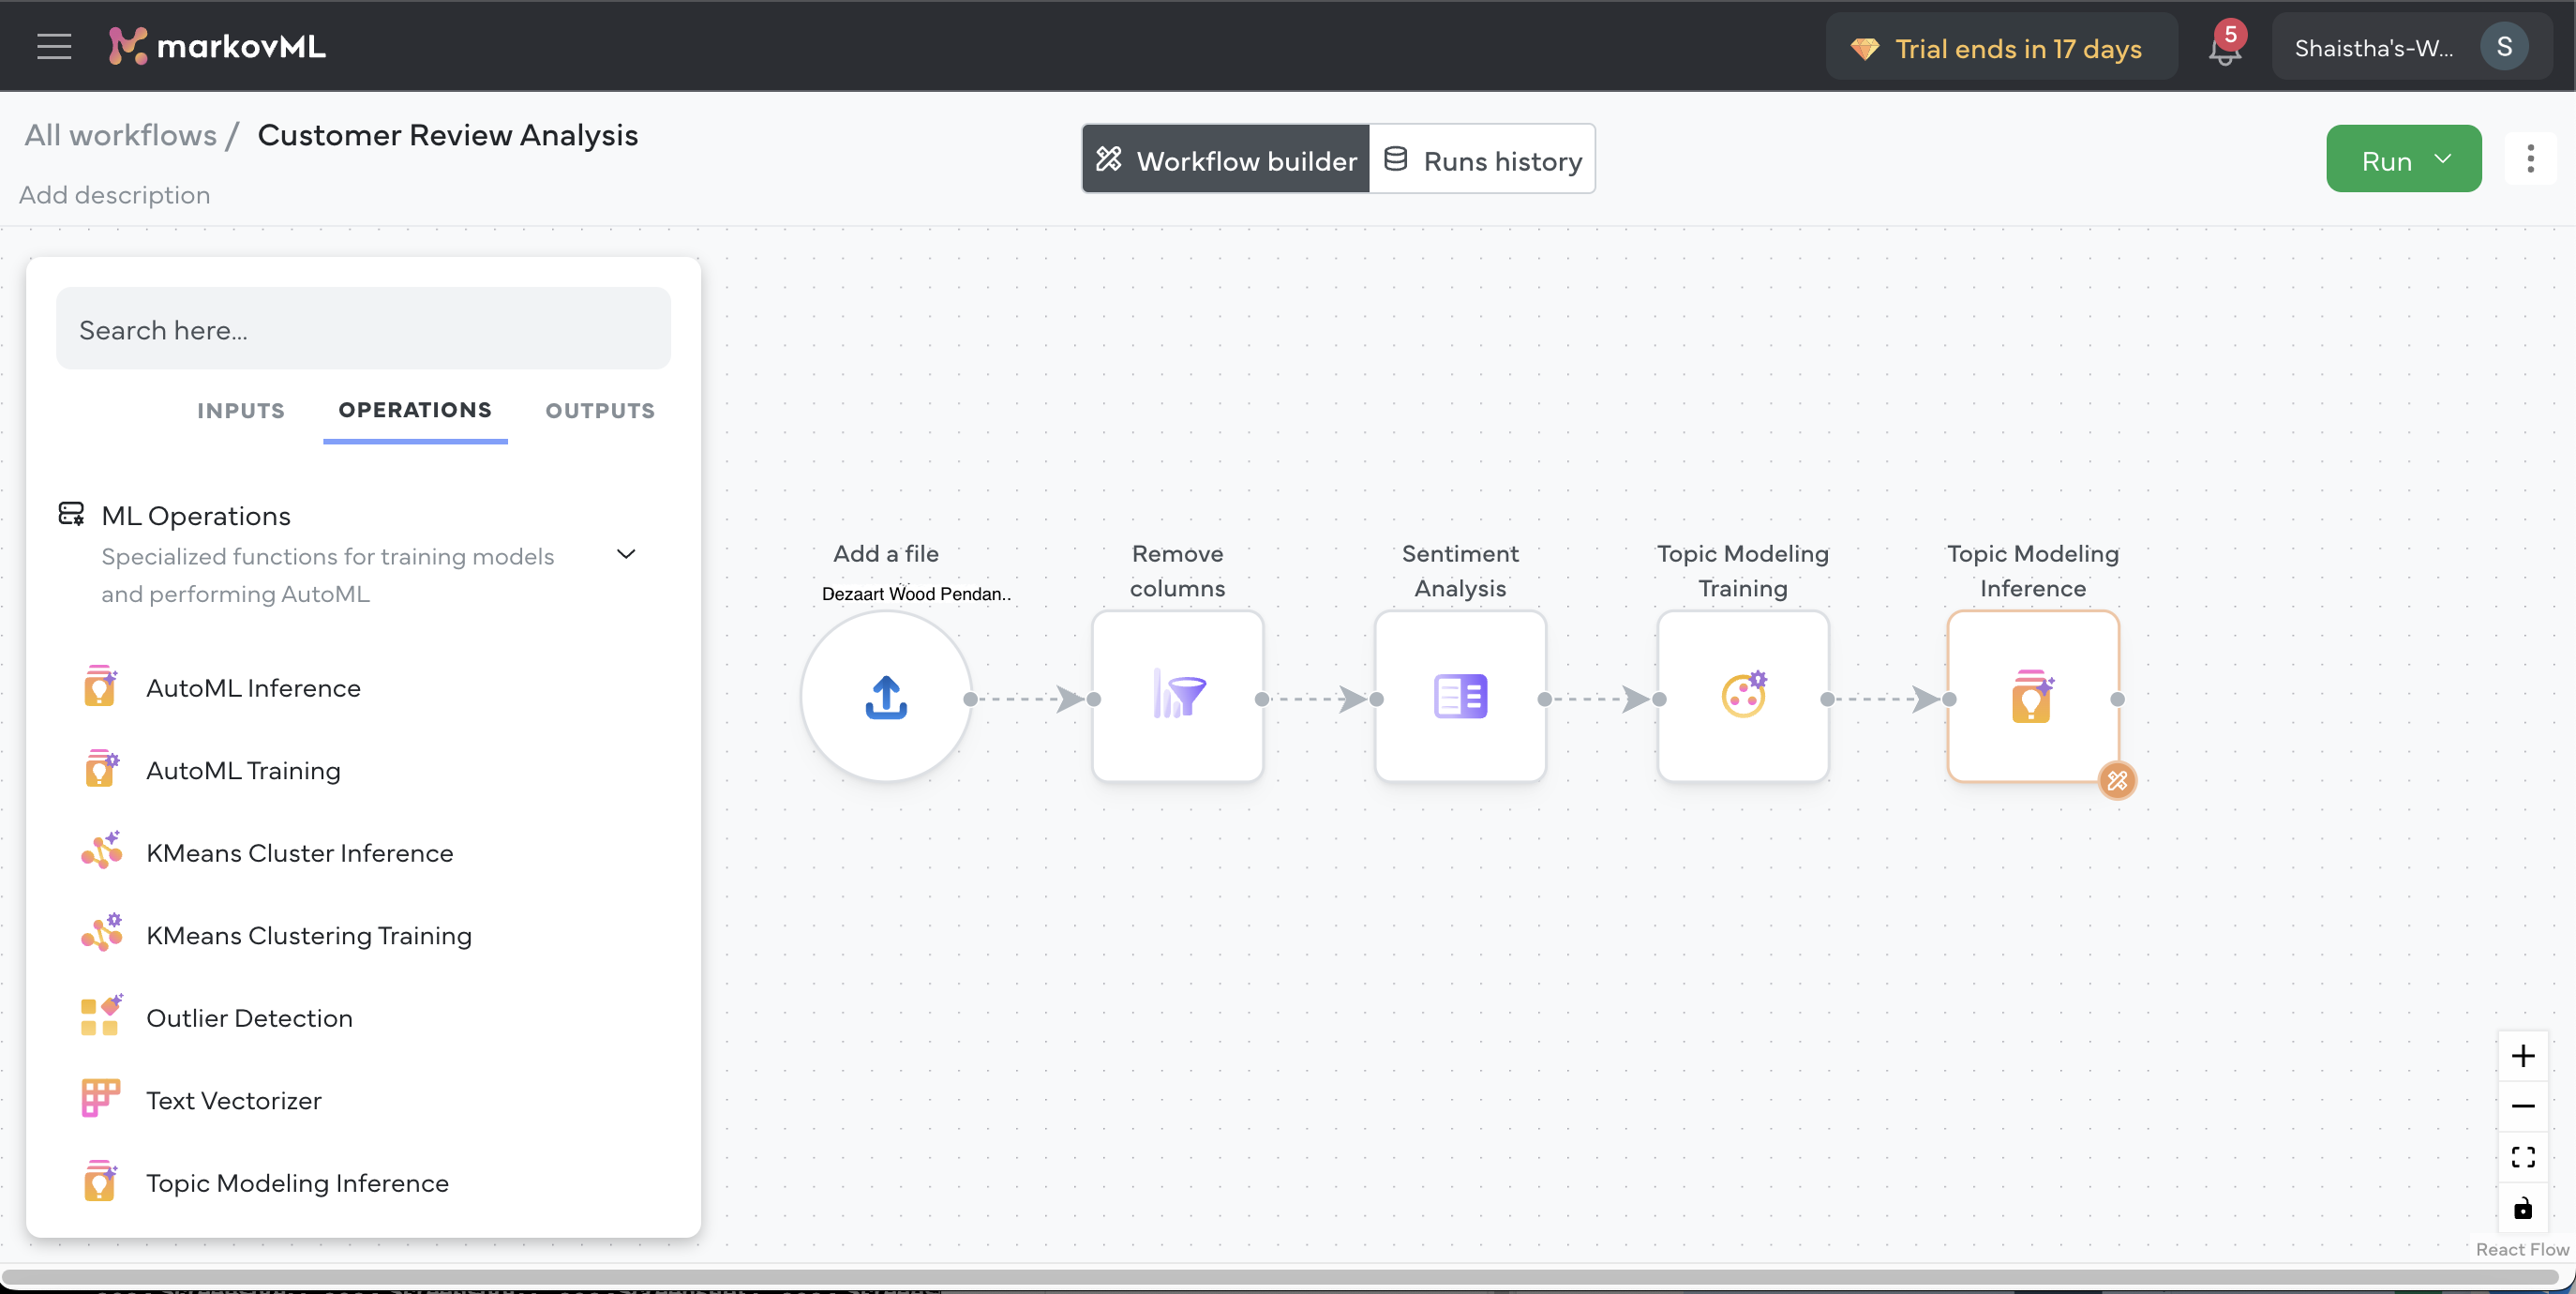
Select Topic Modeling Inference under ML Operations. This should add a new block to the flow, as shown below.
-
Click on the Topic Modeling Inference block (or the pen icon) to open its settings.
-
Set "content" as the feature column, and set a name for the output column, such as “Topics Discussed.”
-
Check the Use context model option for more accurate topic detection.
-
Click on the Apply changes button and preview the results.
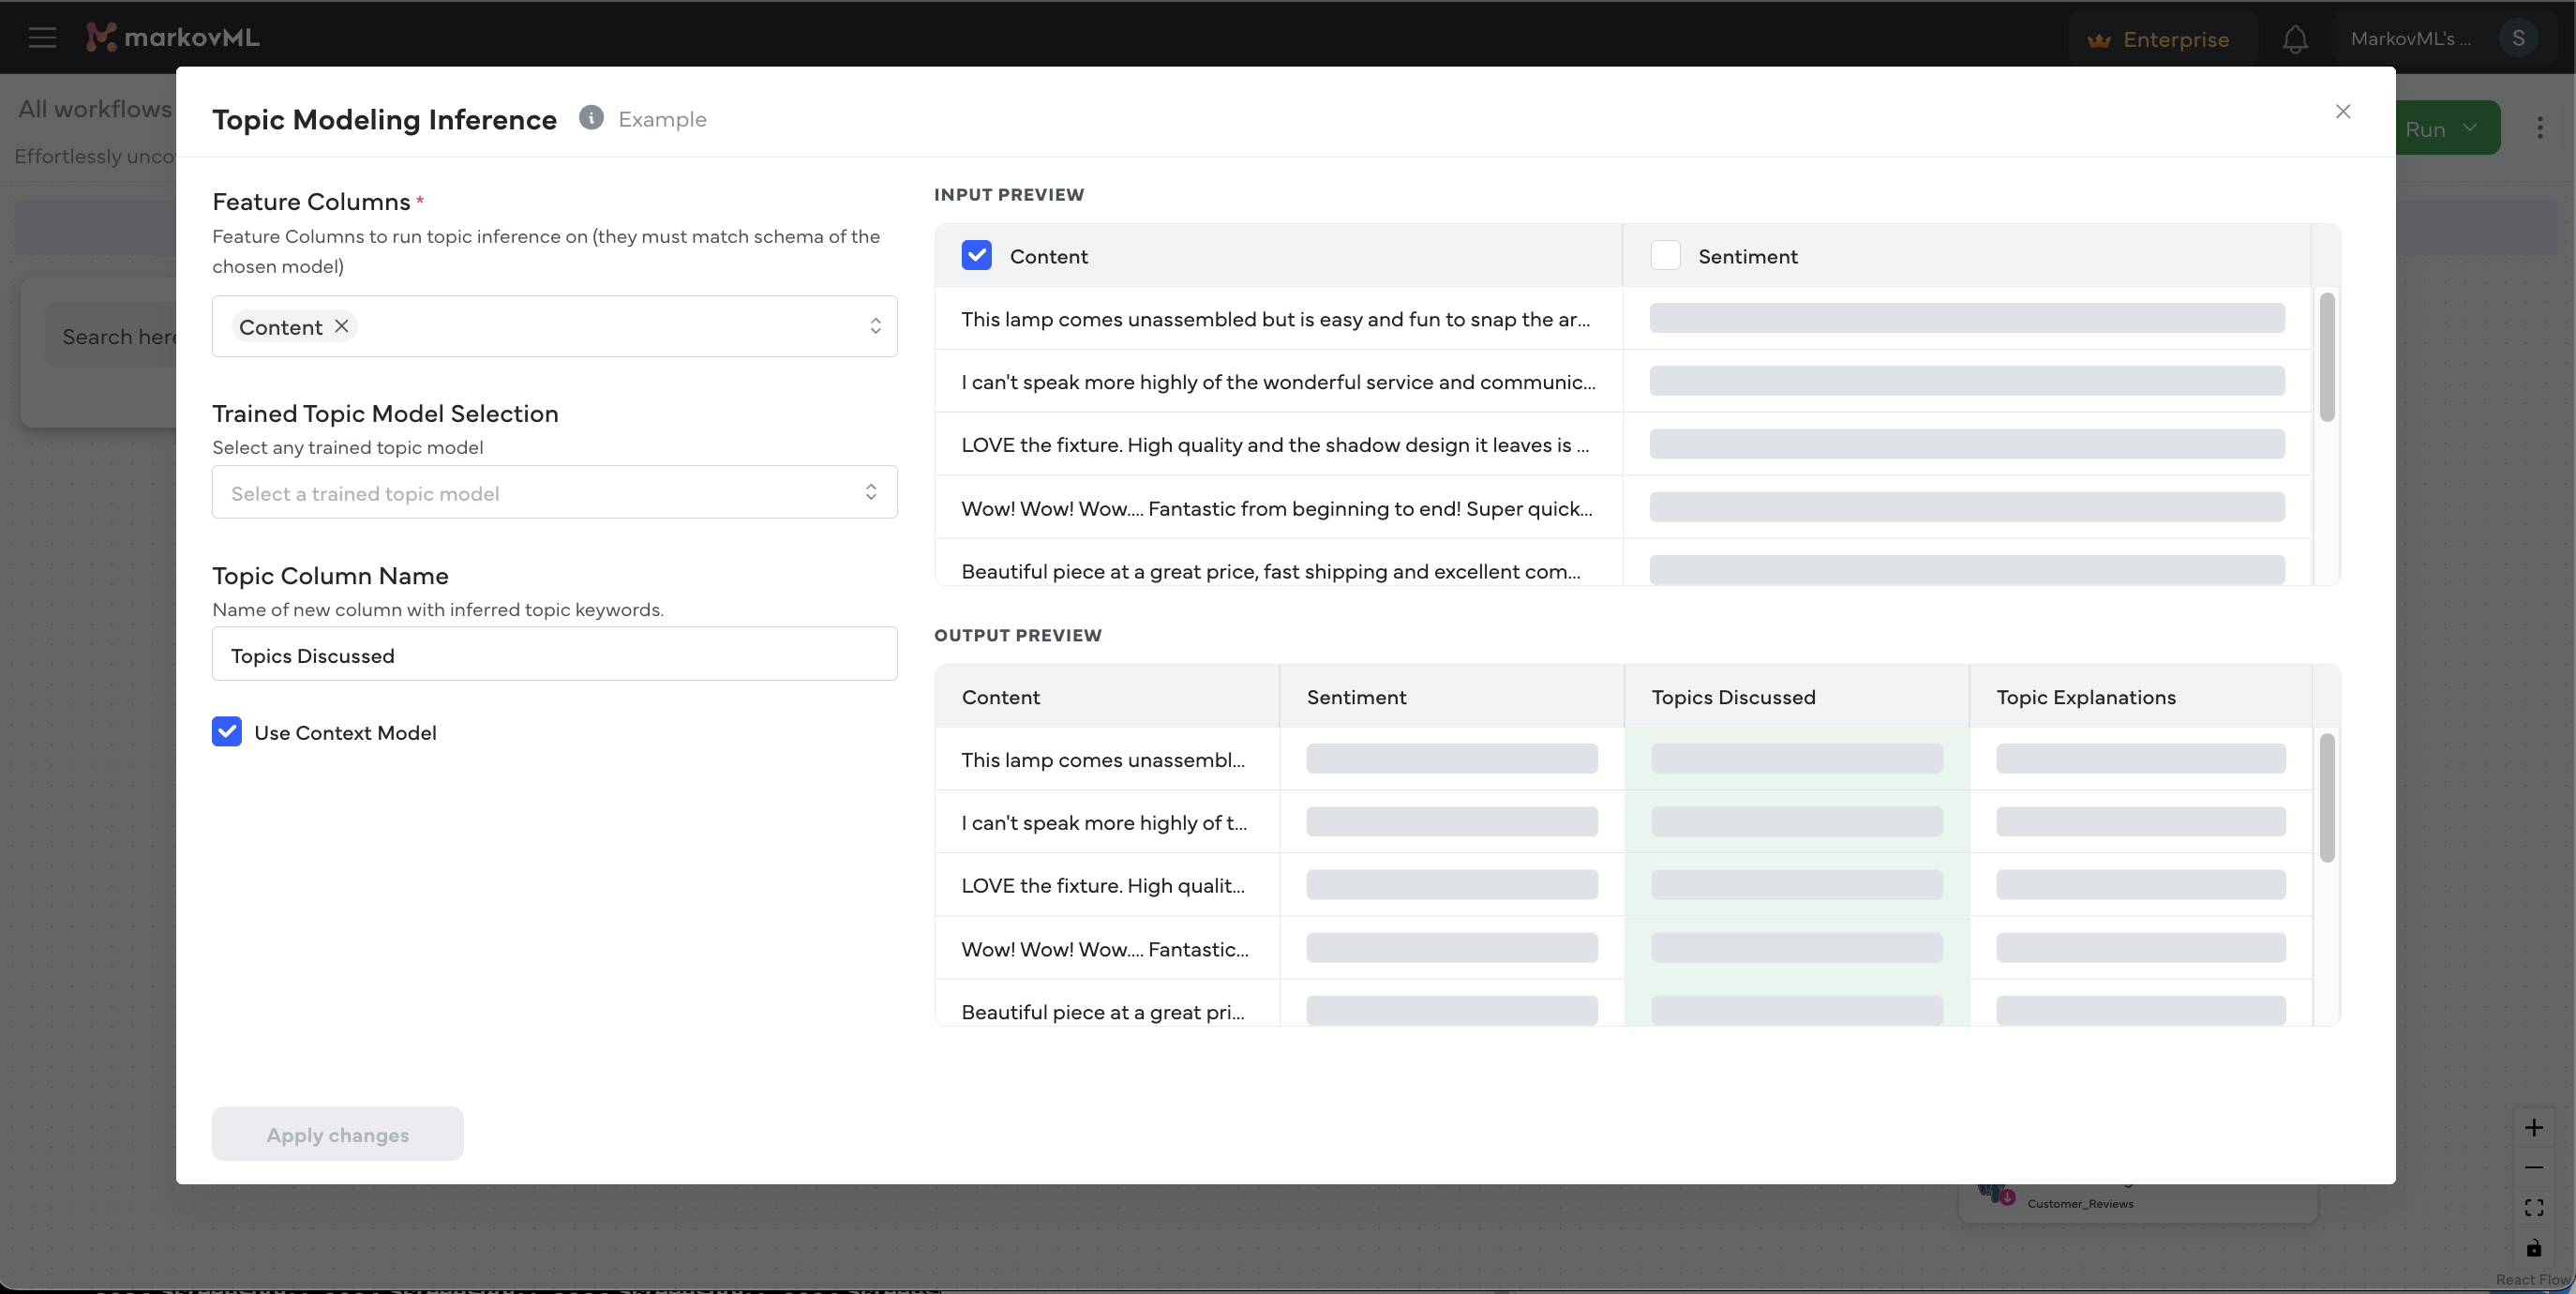
After these steps, your result file should have additional columns, including “Sentiment,” “Topics Discussed,” and “Topic Explanations.”
Step 3: Add an Output to Store the Results
Once the data is processed, you need to save the results. MarkovML offers various output options similar to the input sources.
-
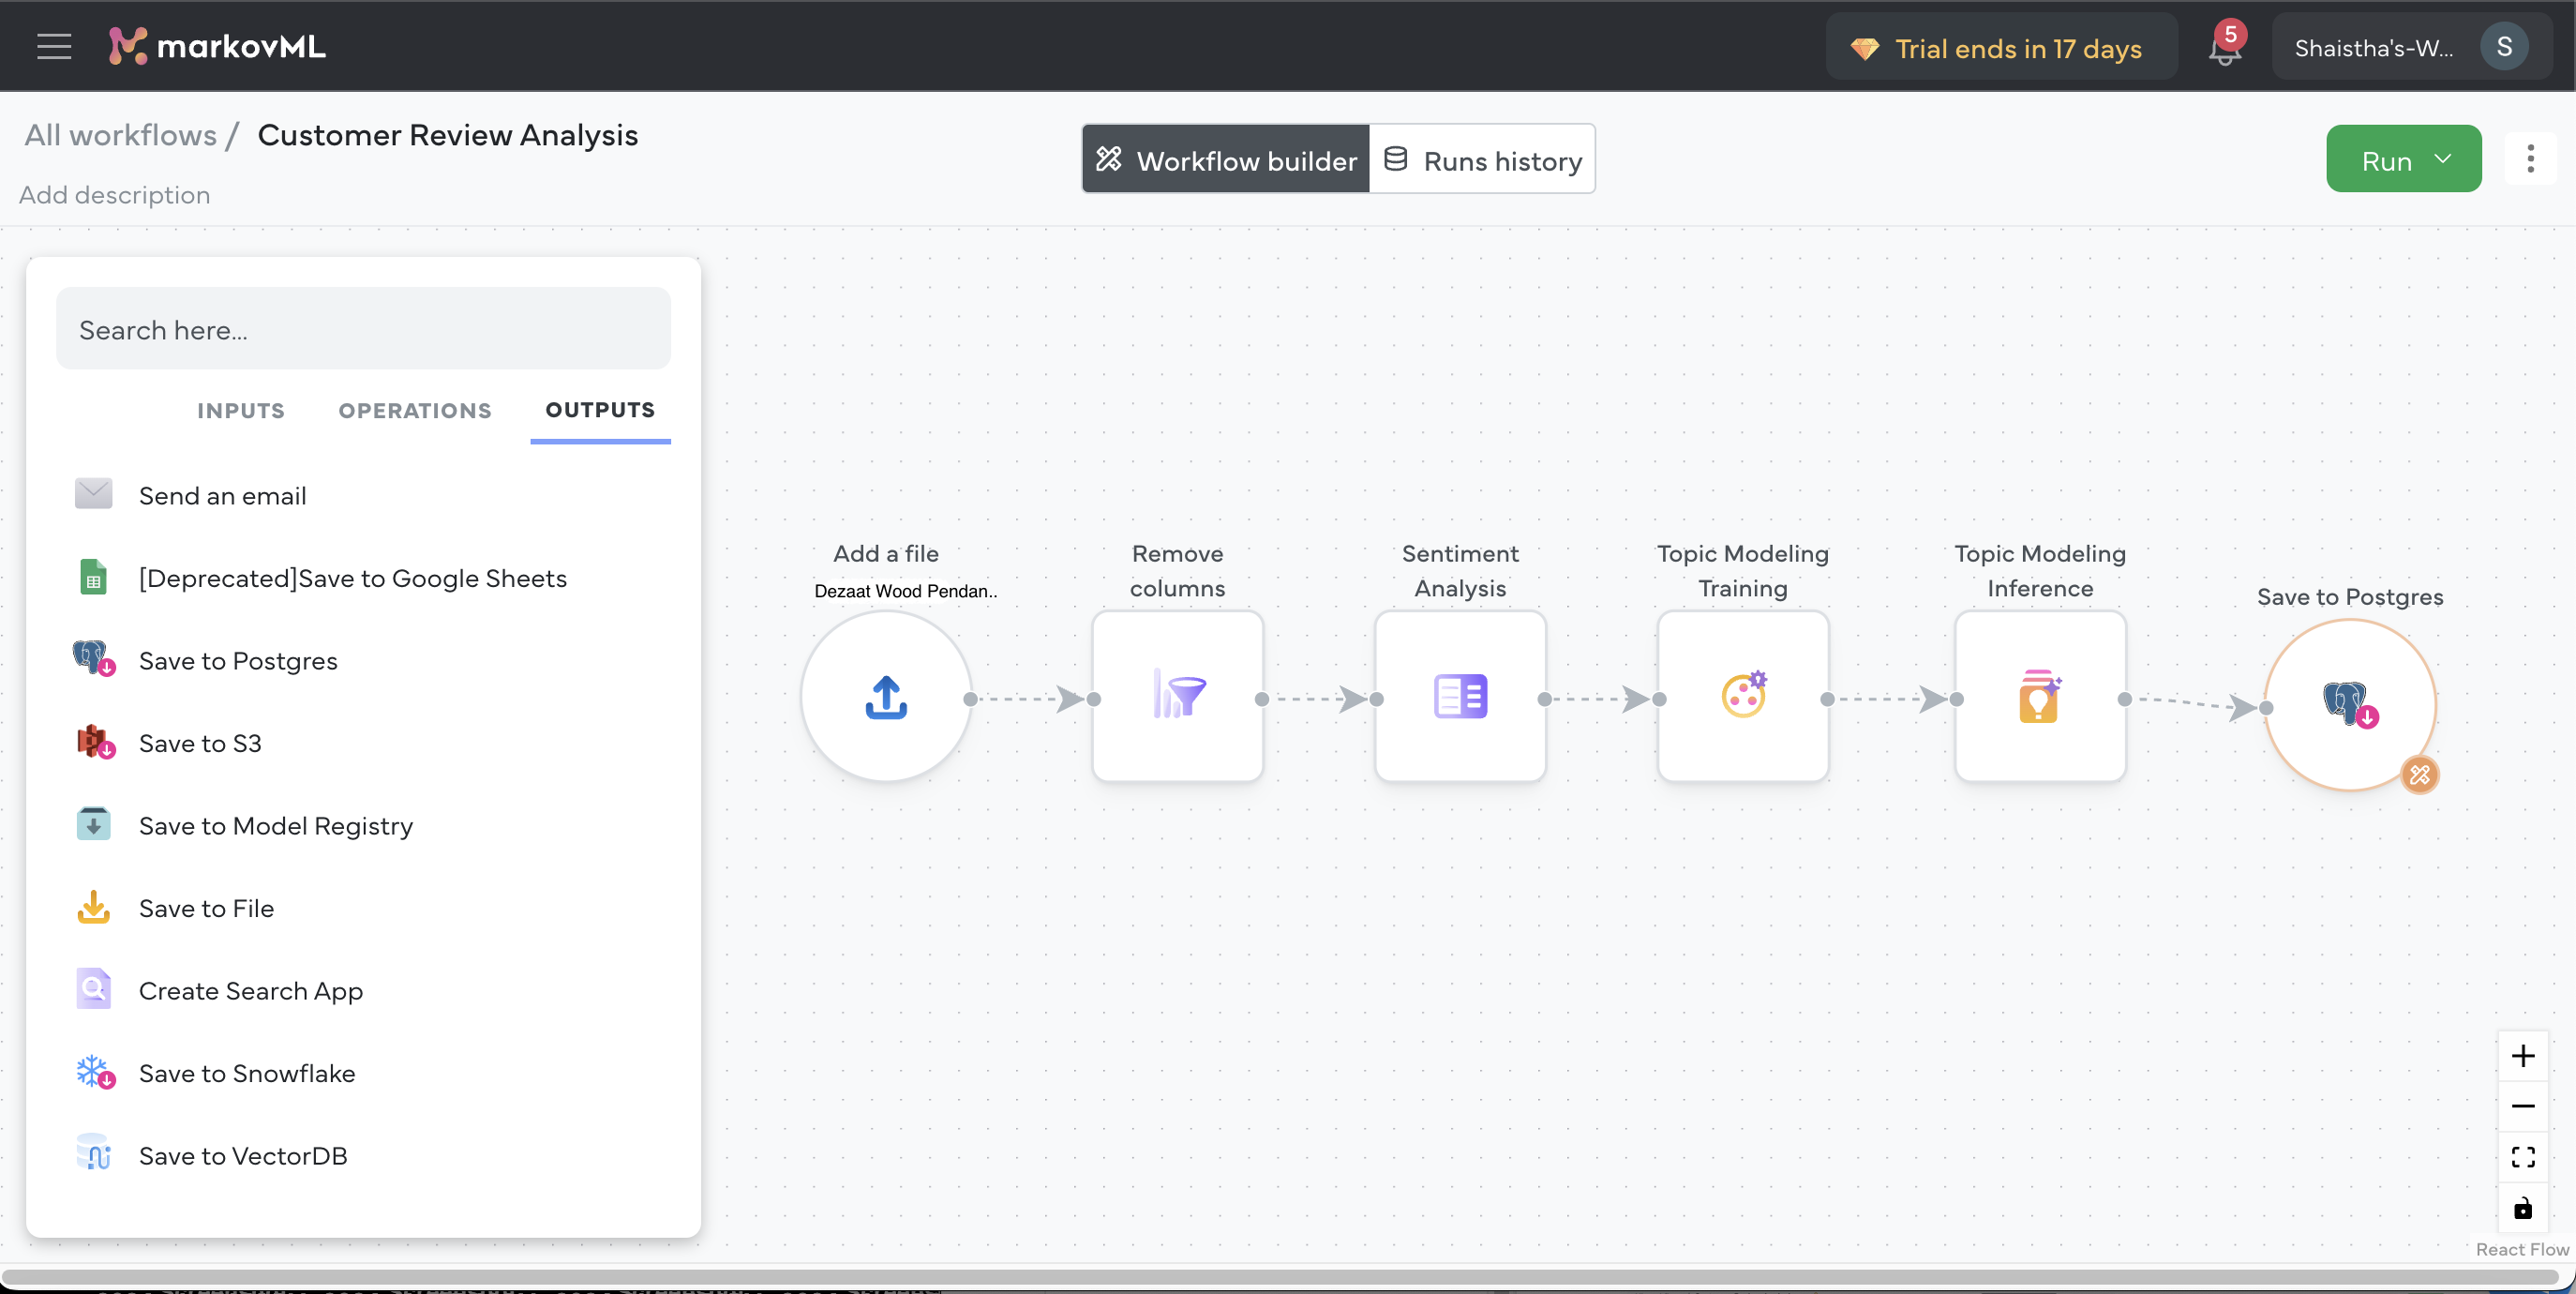
Under Outputs, select Save to Postgres to save results to a PostgreSQL database. The output block will be added to the flow.
-
Click on the Save to Postgres block (or the pen icon) to open its settings, and click on Add new button.
-
You can choose to use an existing connector or Add connector and enter the required database details.
NoteCurrently, we only support PostgreSQL as an OUTPUT to build a dashboard.
Now, your workflow is ready to run!
Step 4: Run the Workflow
Here’s the exciting part—running your workflow to see everything in action! Just click the Run button at the top right corner of the page.
NoteDon’t forget to lock your workflow to prevent any further changes by your team members after it’s ready to go. Check "How to lock and unlock your workflow?"
Step 5: Launch the Dashboard
To launch a dashboard, click the Launch button on the top-right corner. From the dropdown select Visualization dashboard.
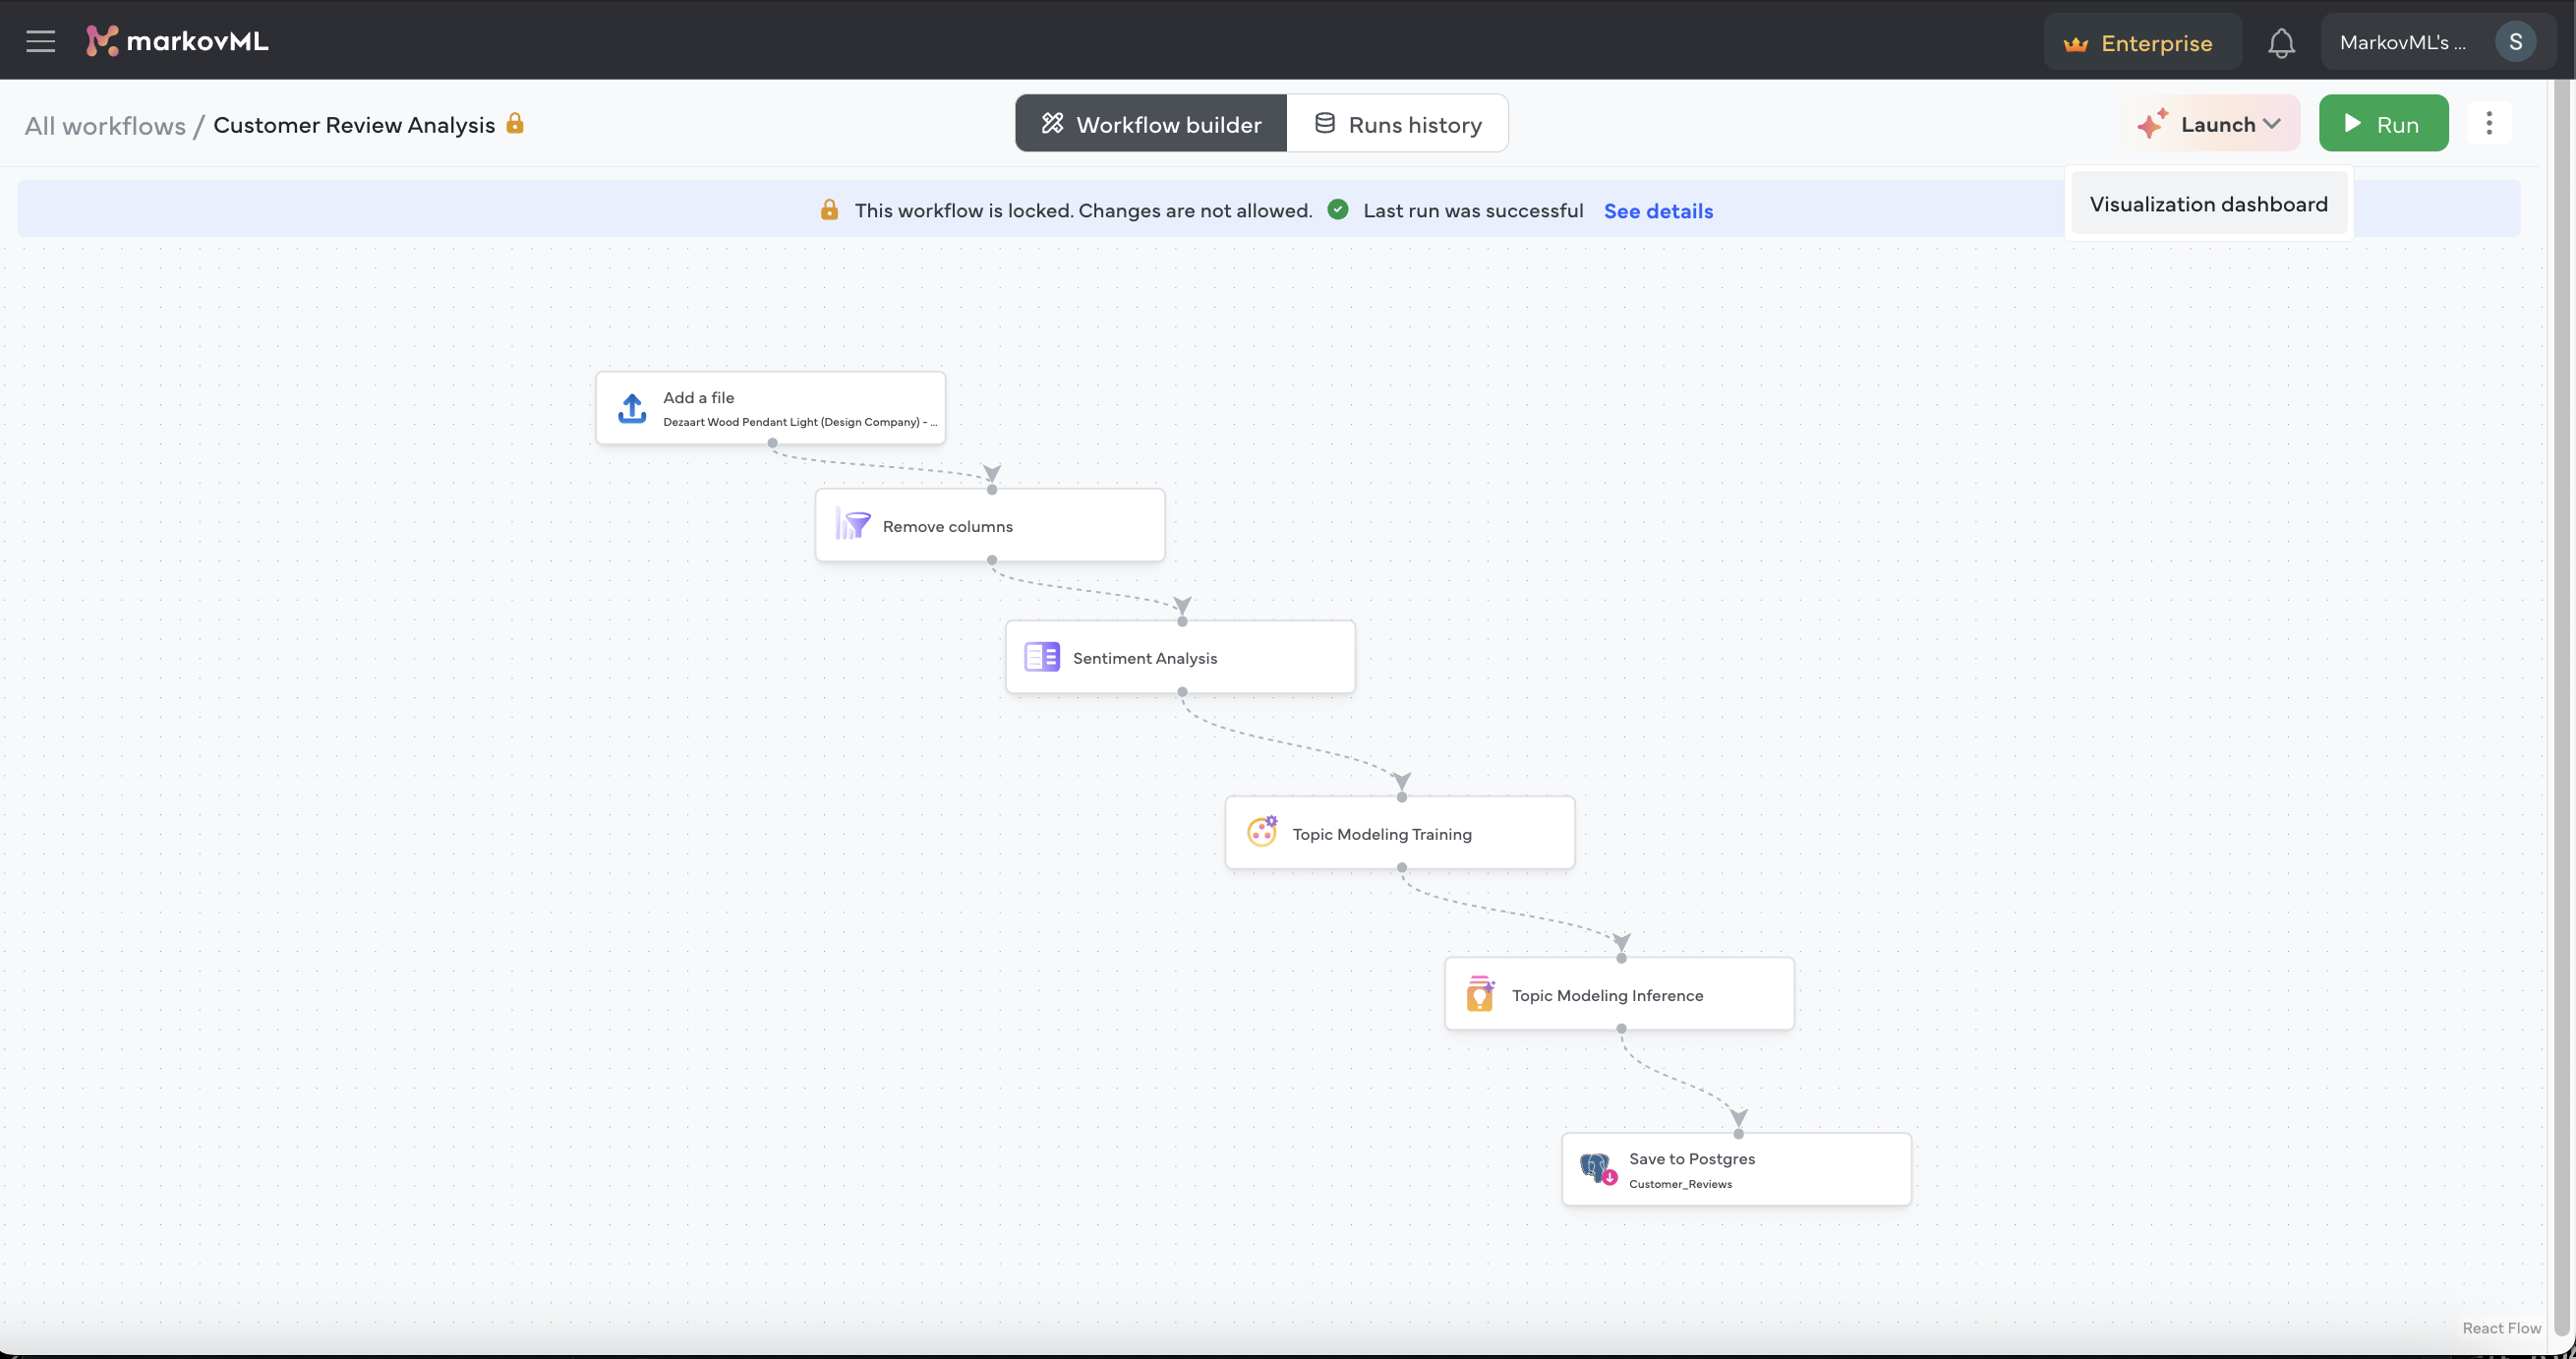
Launch a dashboard
NoteDashboards don’t automatically get created, someone has to manually create them.
This will open a new page as shown below. From here, you can start building your dashboard, click on the
+ DASHBOARD button to get started.
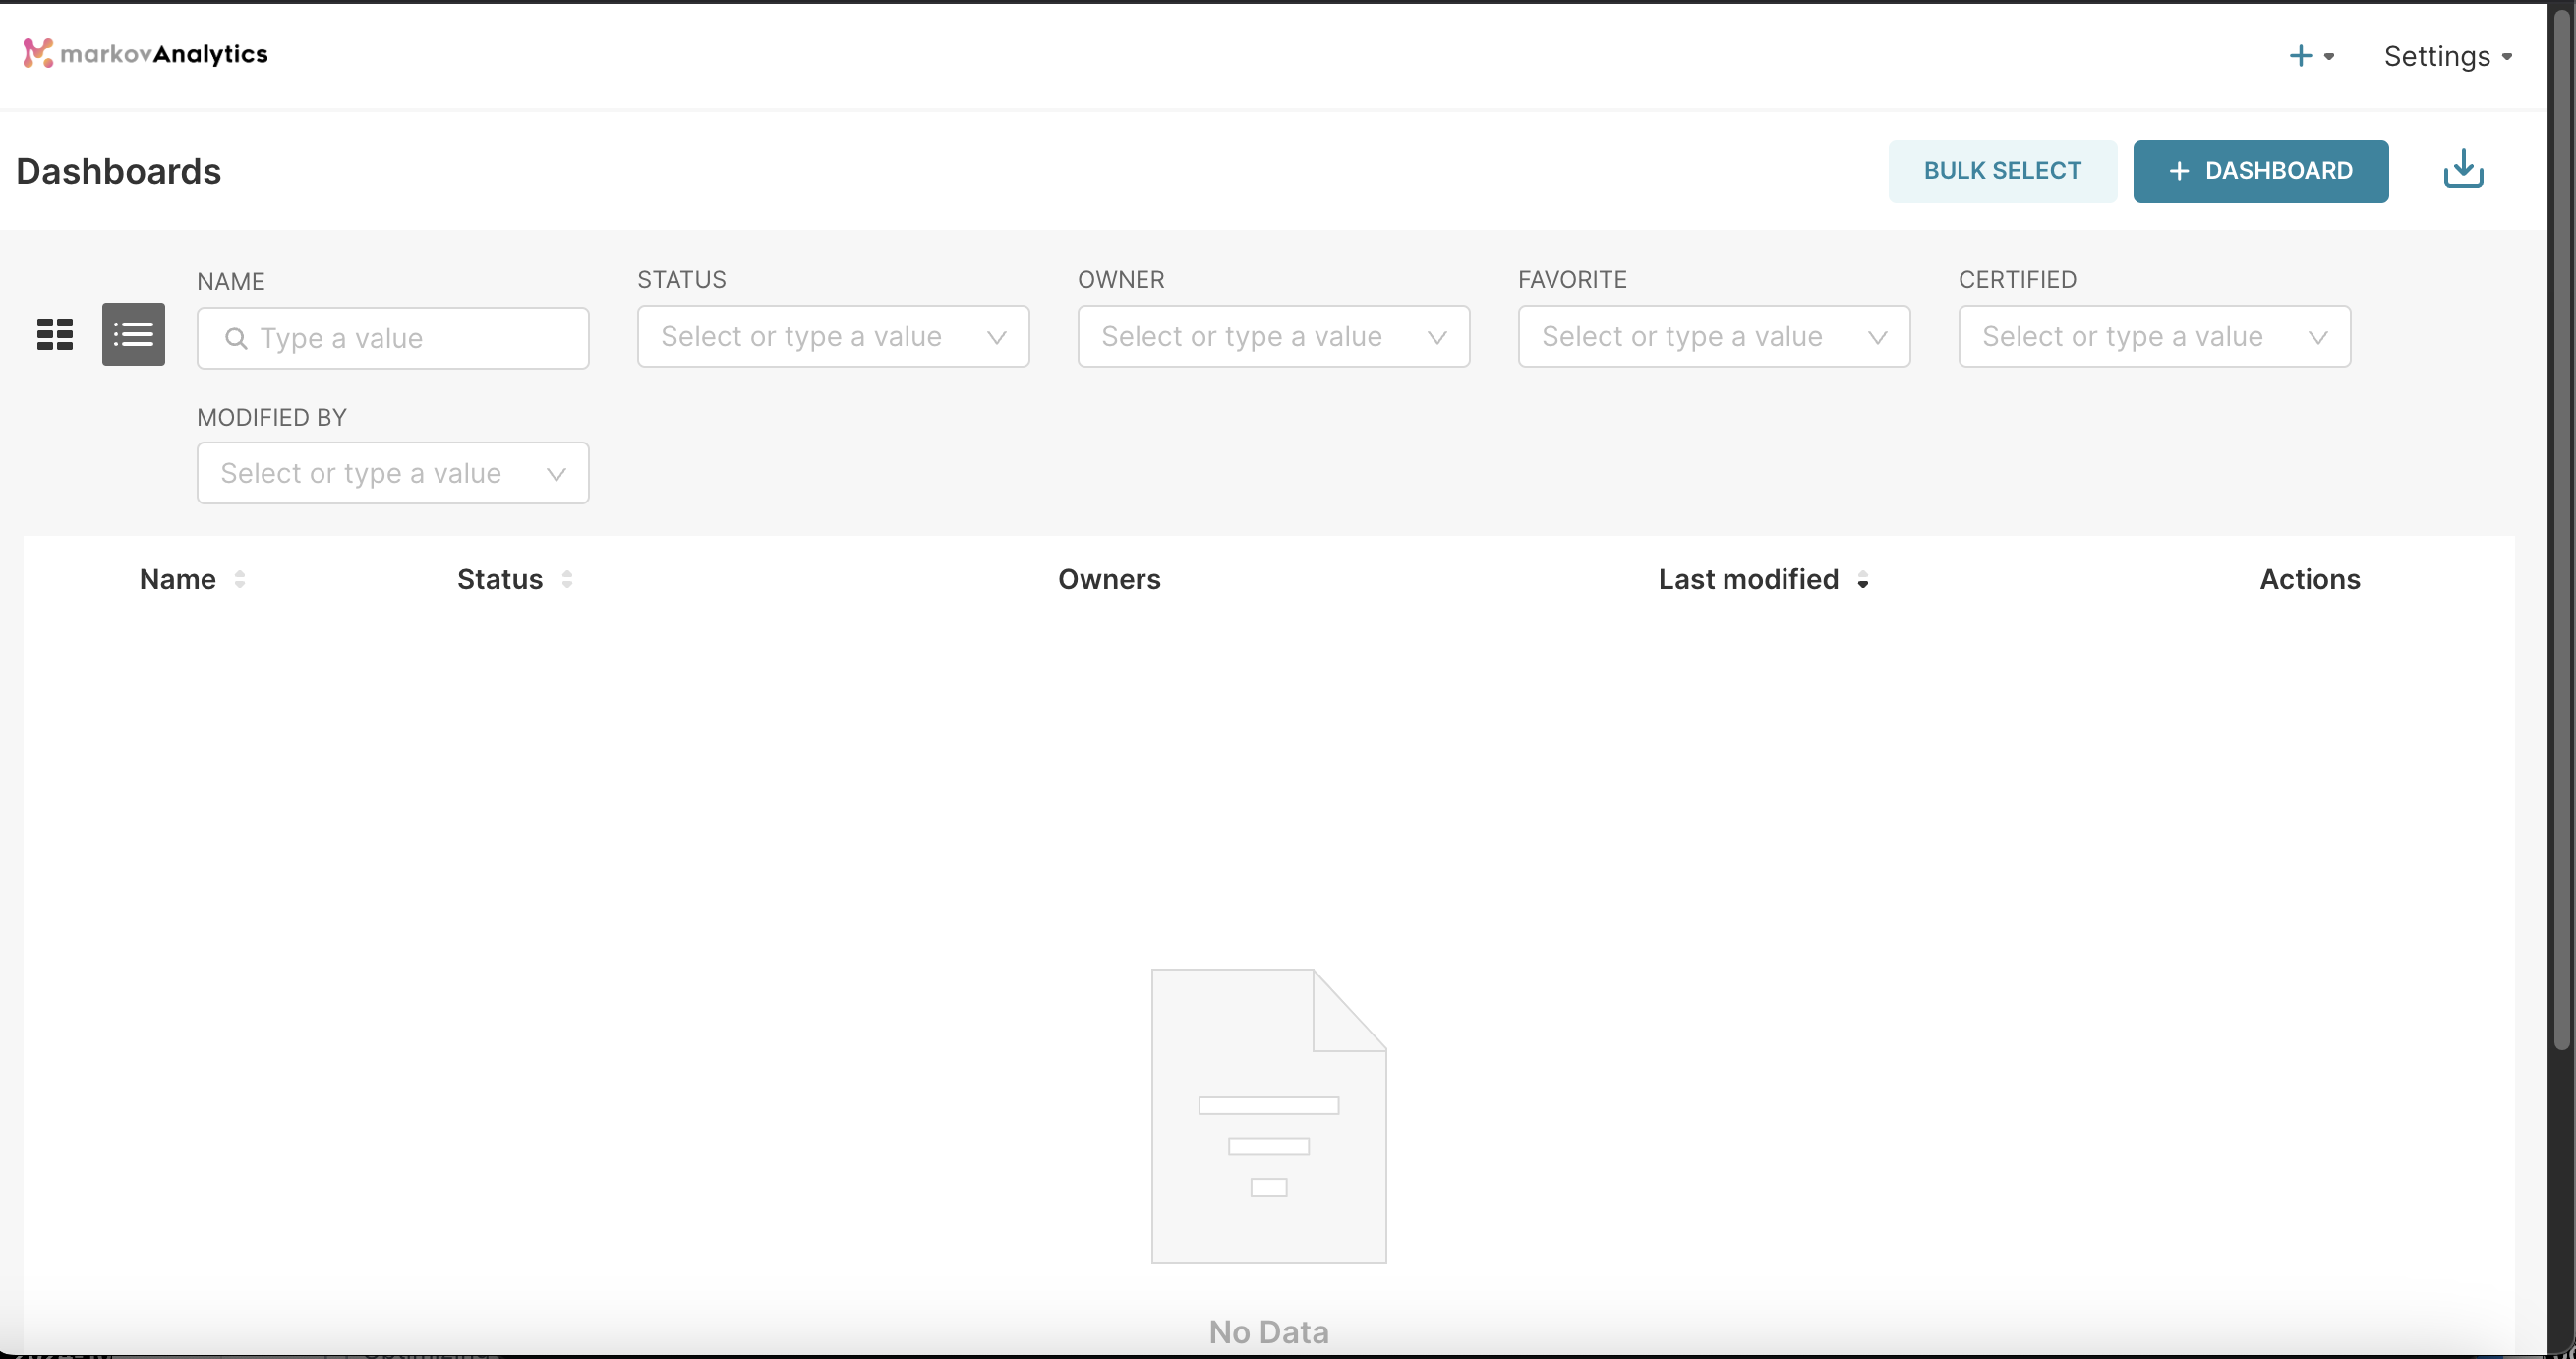
Dashboard page
Start Building your Dashboard
In the new page, as shown below, you may start building your dashboard by creating new charts. To get started, click on the Create a new chart button below. And pick the type of chart you want to build and follow along.
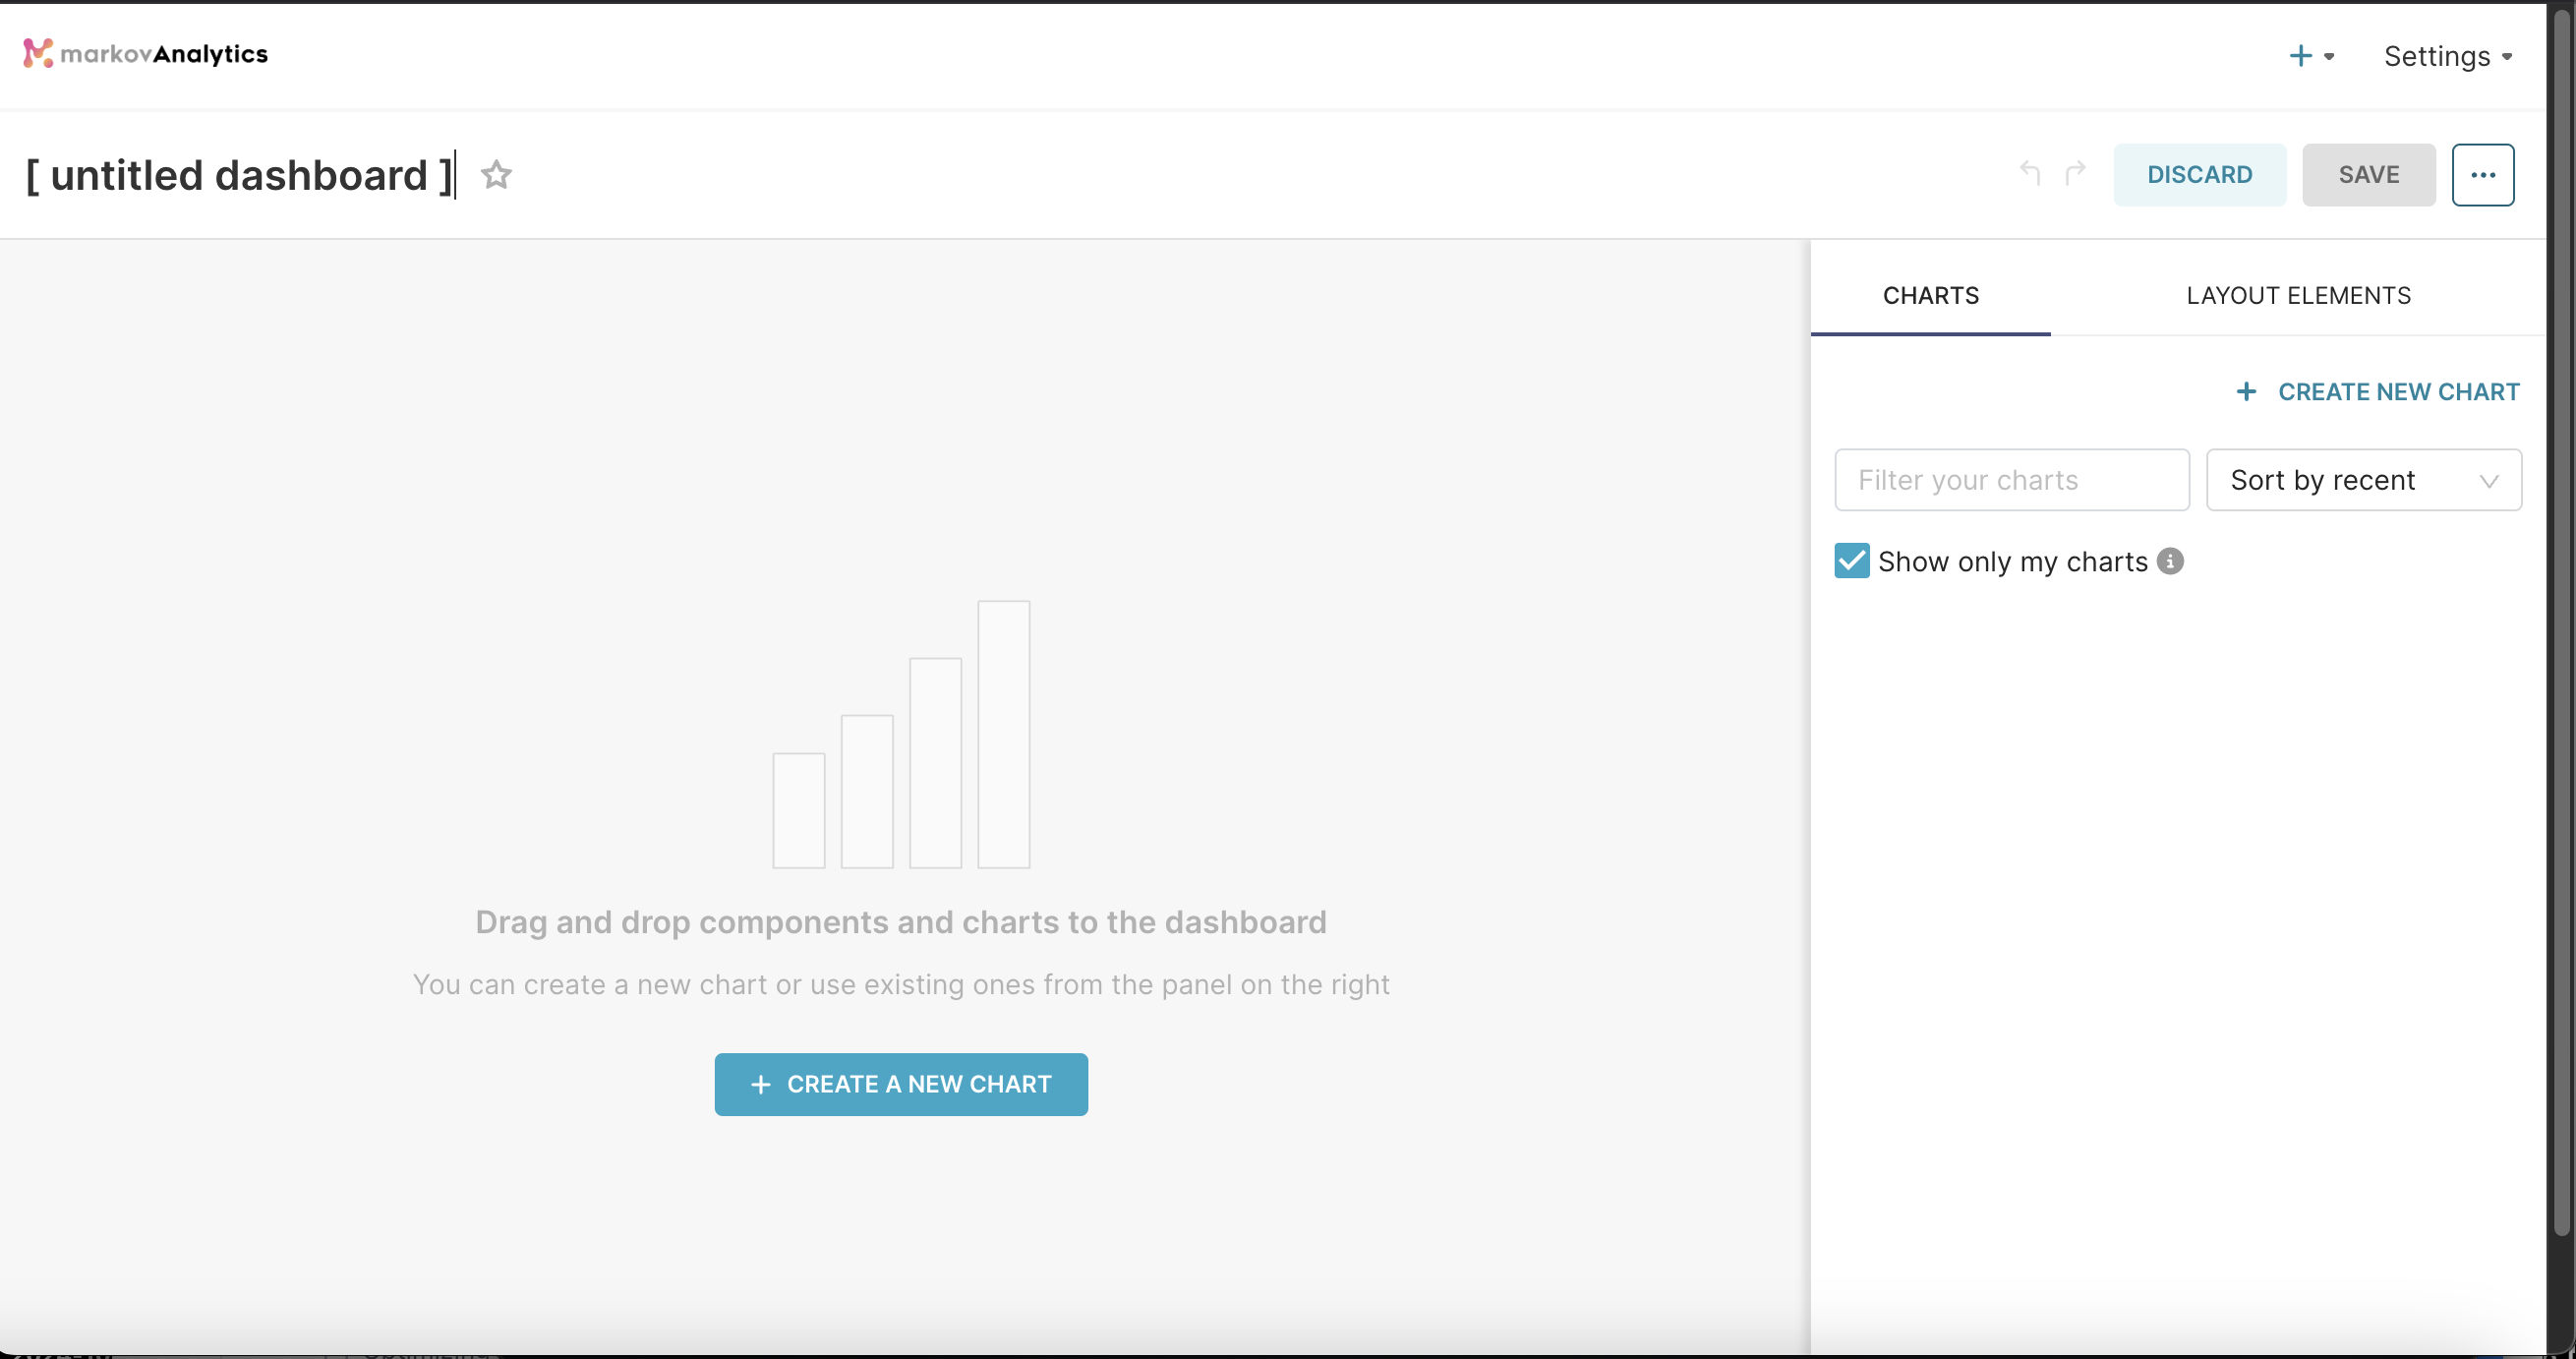
Start building your dashboard
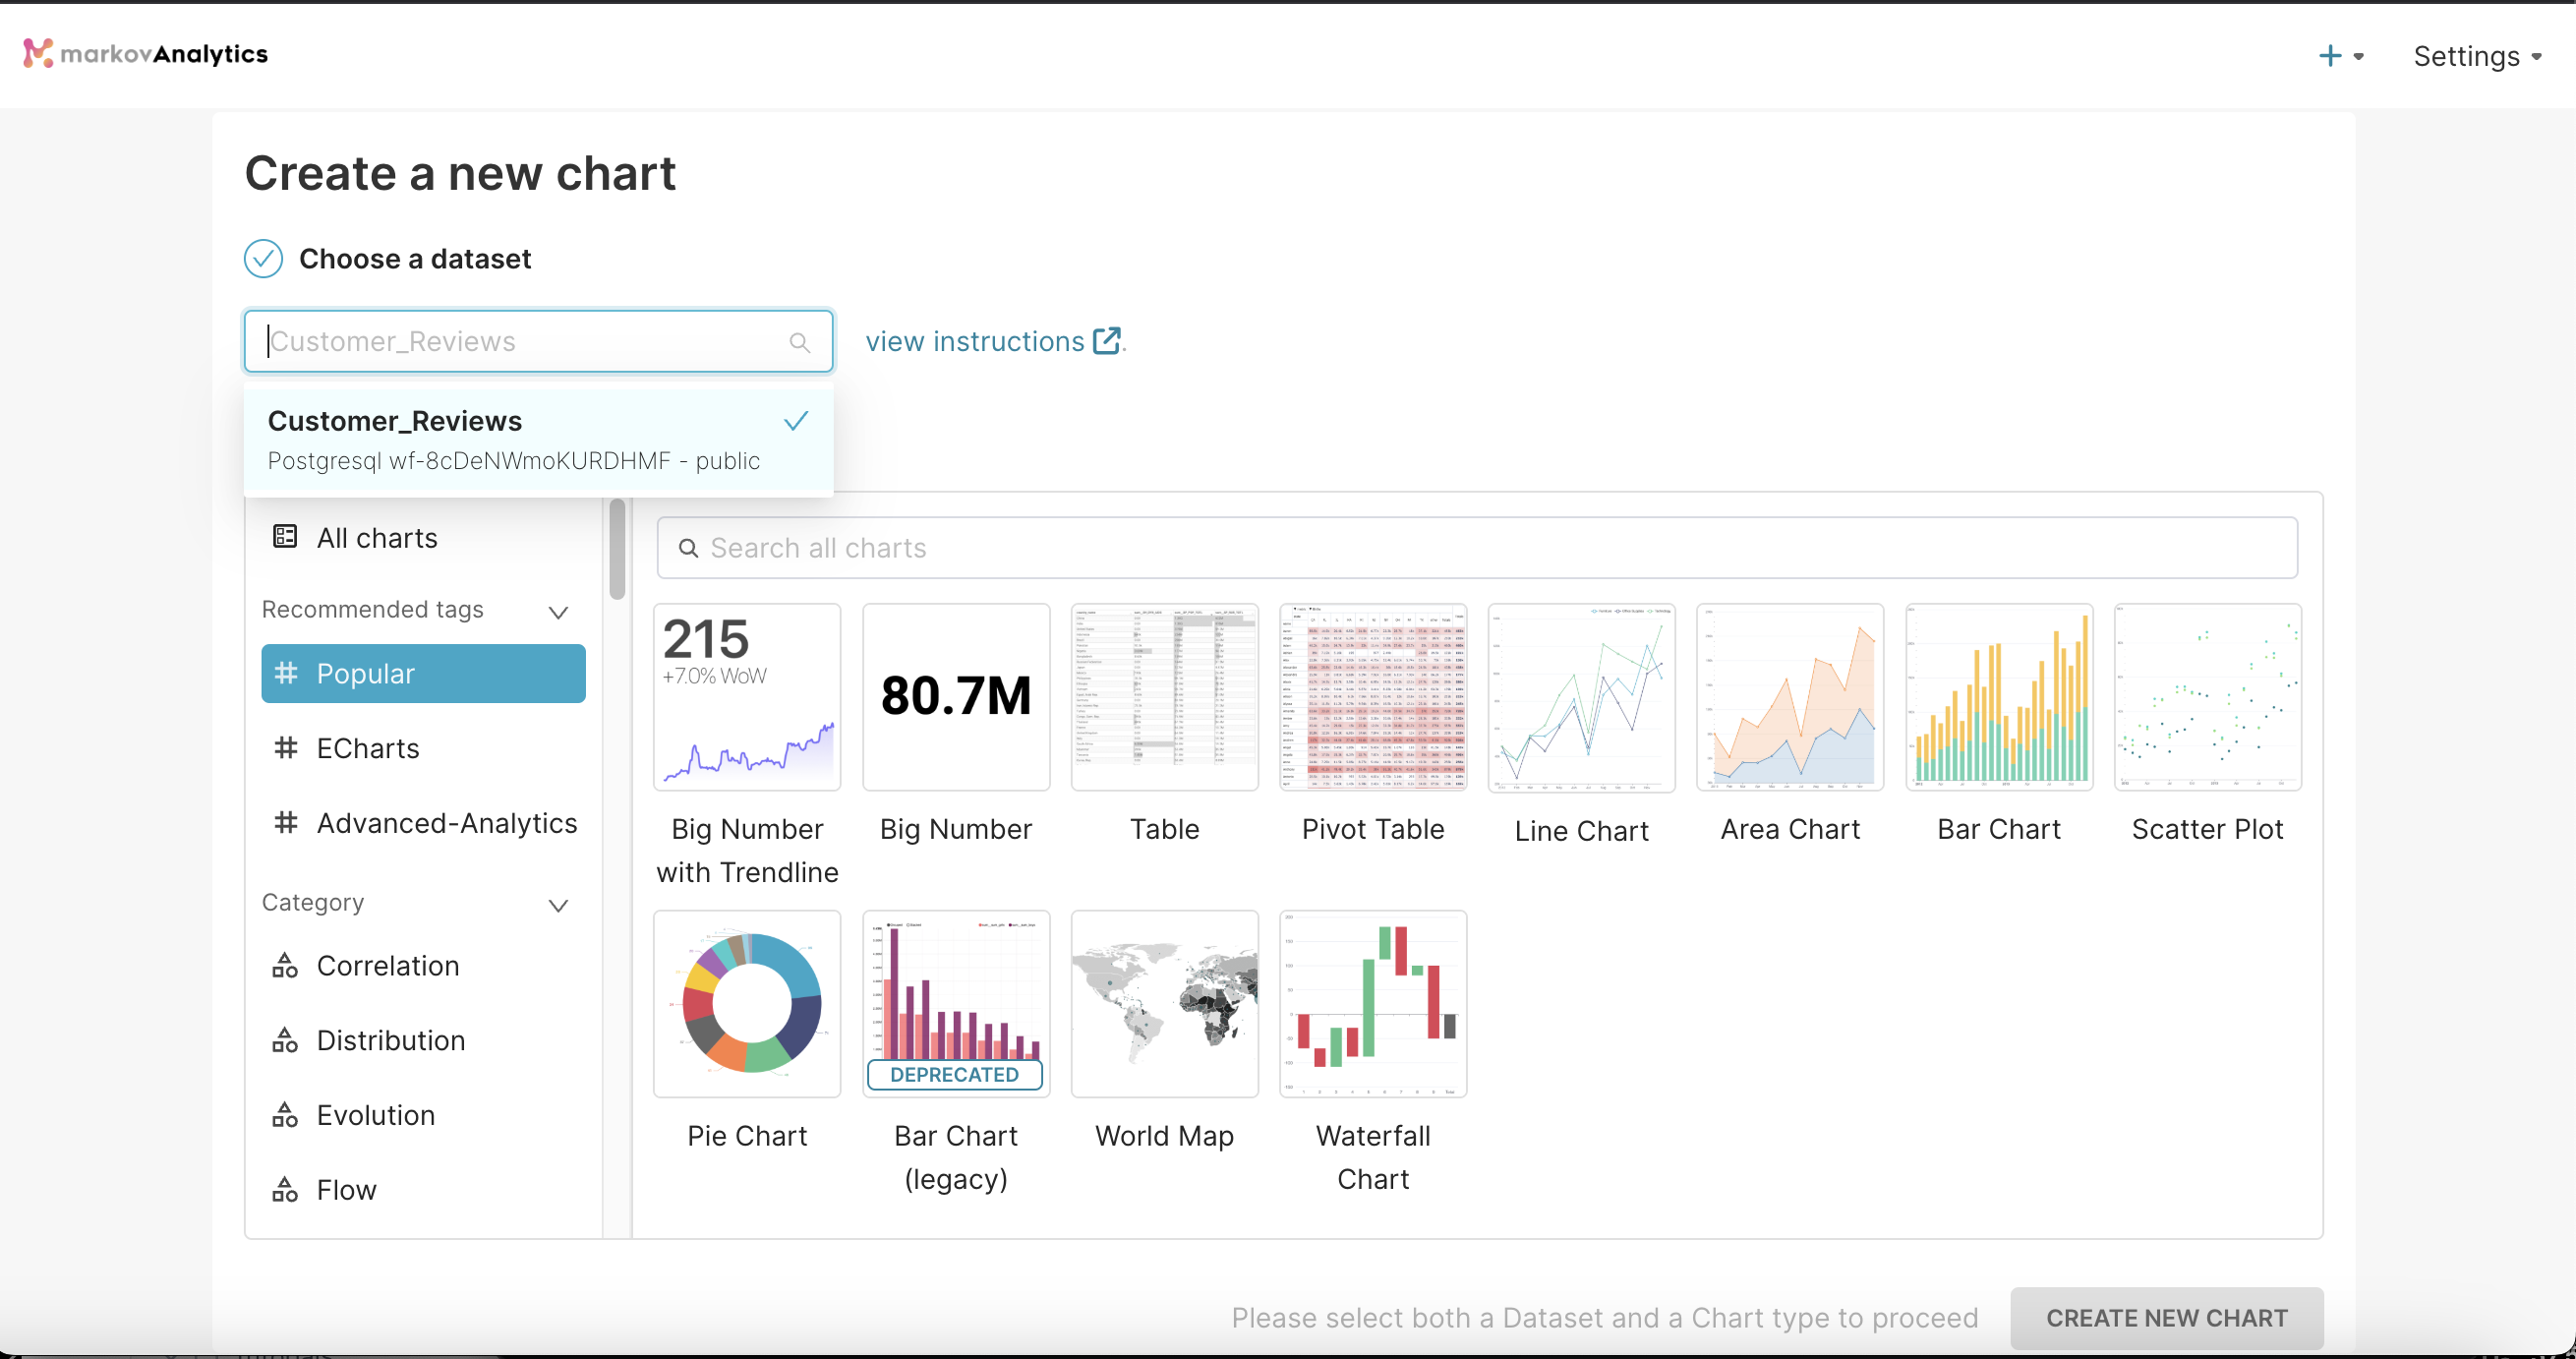
Choose the dataset and select the chart you want to build
Once done, publish the dashboard. It should look something like this. For a detailed guide on creating your own dashboard, explore this link.
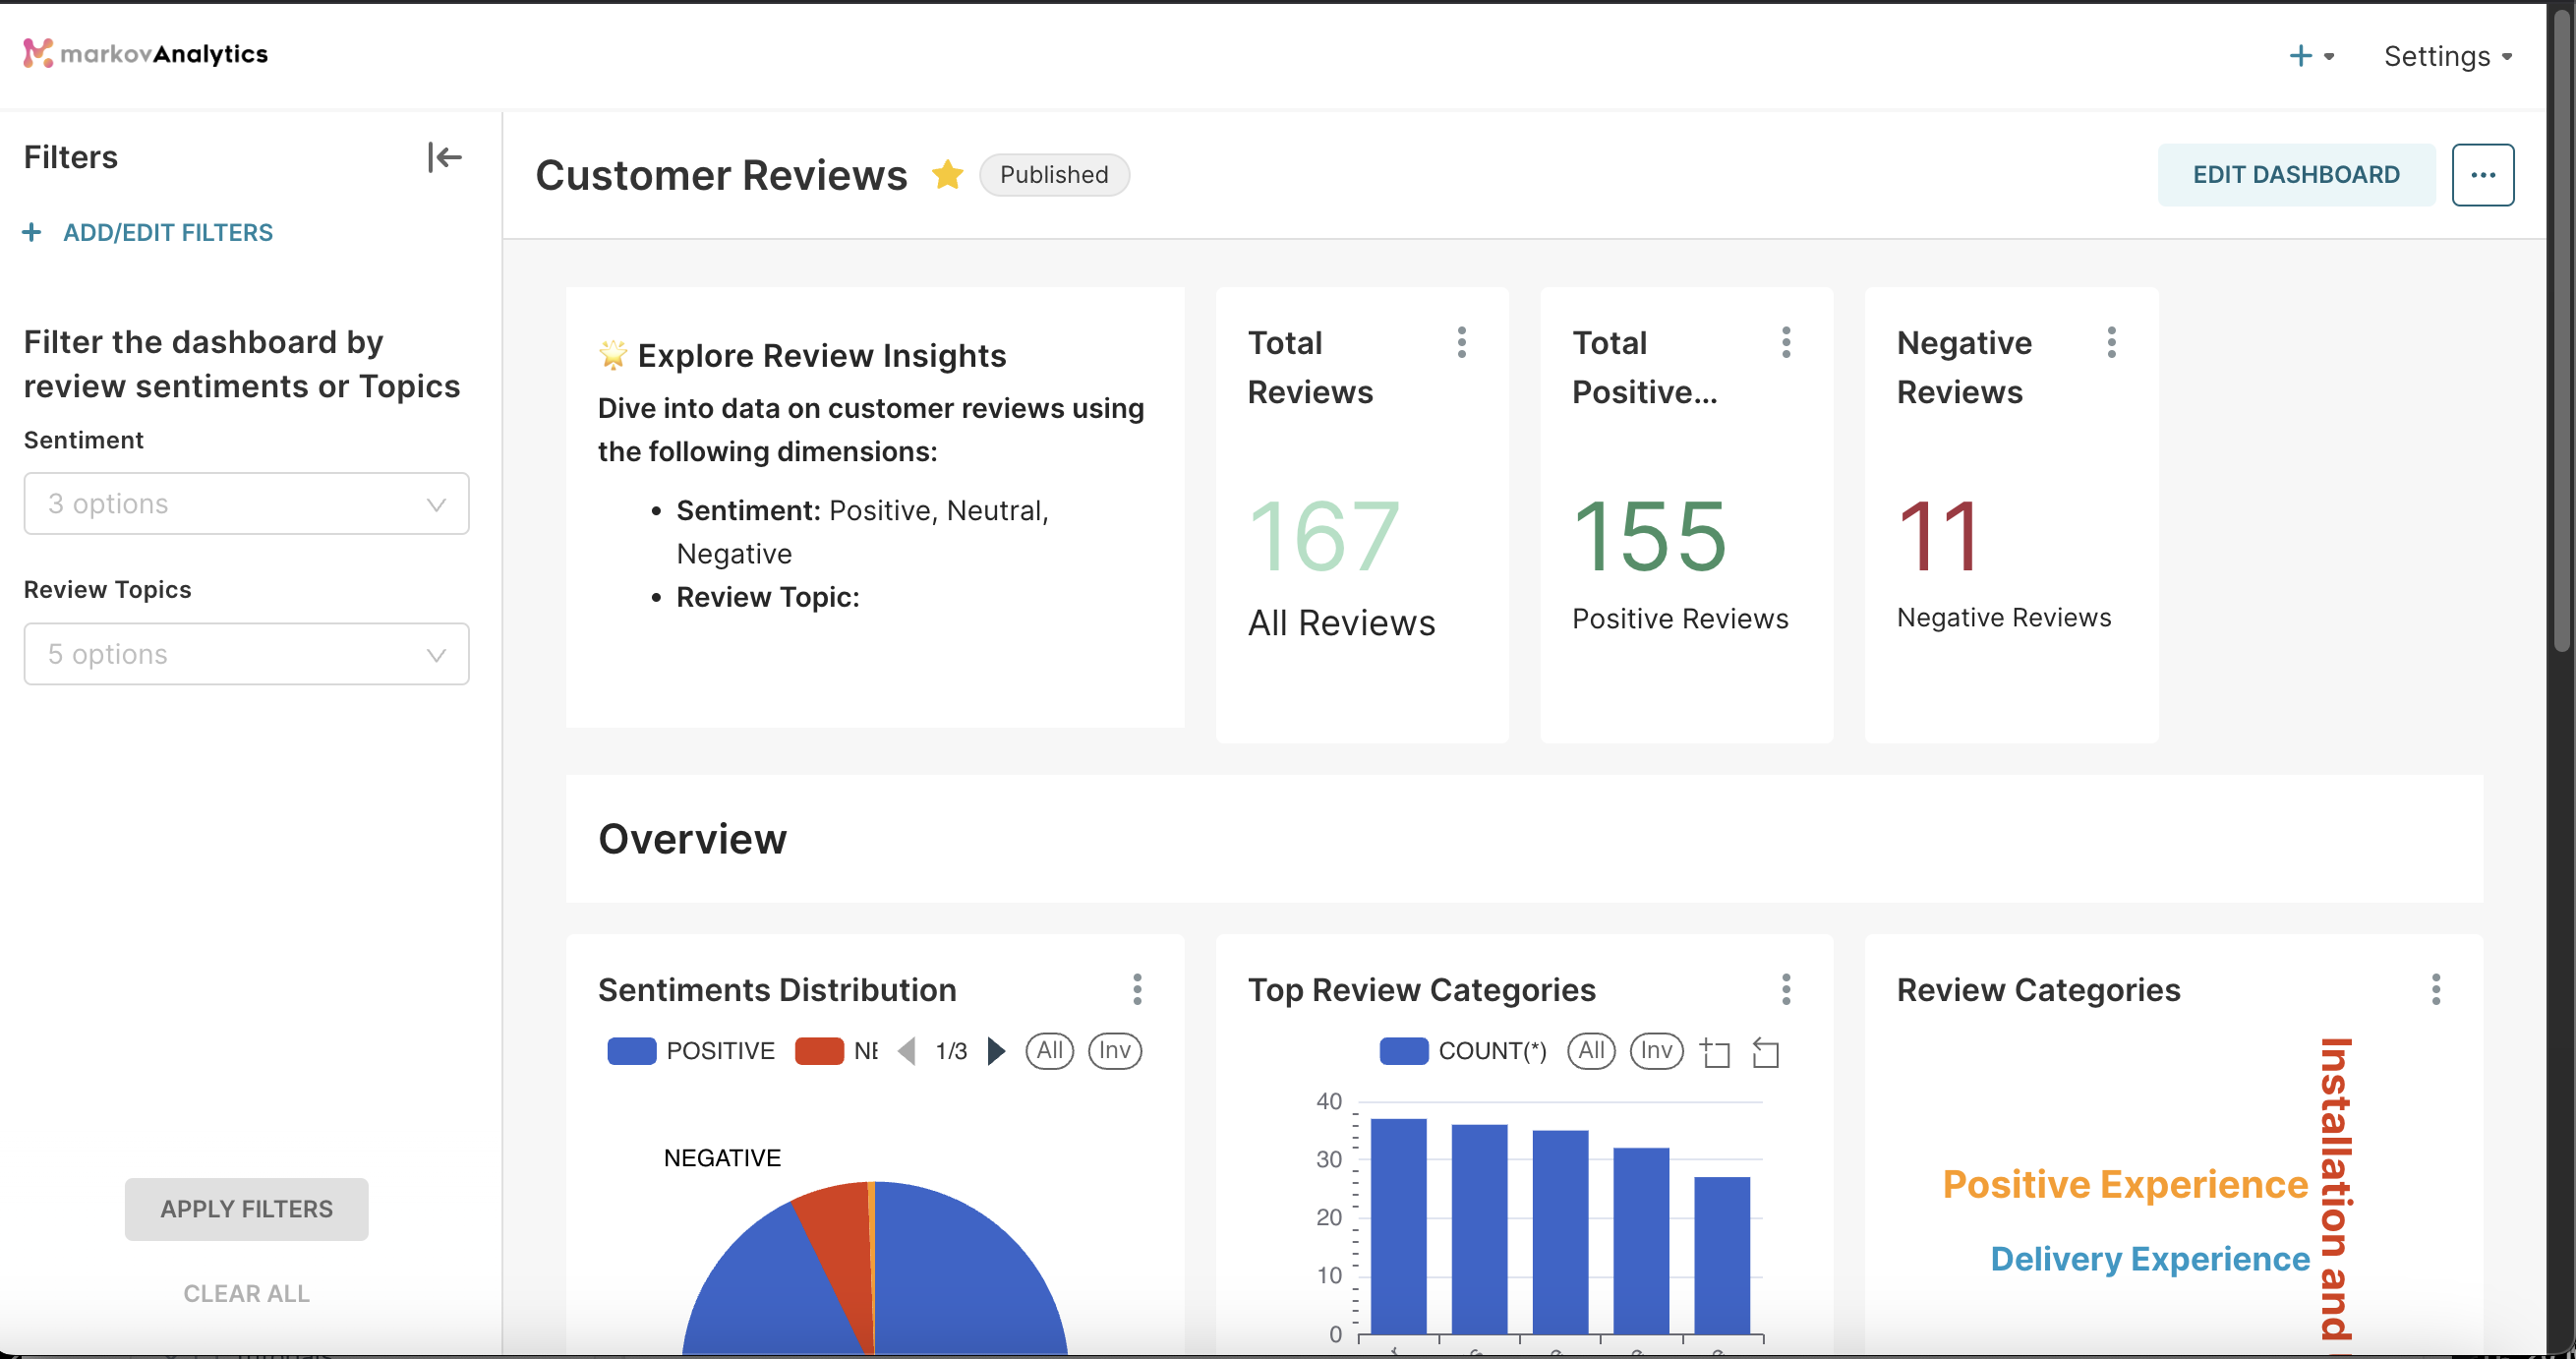
In the dashboard, you can view charts and graphs summarizing customer review sentiment, common topics, and other insights that emerged from your analysis.
And that’s it!
You have successfully created a customer review analysis workflow using MarkovML and visualized the results in the dashboard. This setup will help you understand customer feedback at a glance, making it easier to identify trends and make data-driven improvements.
Happy analyzing!
Updated 3 months ago
