Sales Forecasting
Perform sales forecasting using Markov's AI Workflows and build a dashboard to visualize the results.
Sales Forecasting using Automation Flows
Sales forecasting helps businesses predict future sales based on past data, and automating this with automation flows can save time and improve accuracy.
This tutorial will guide you step-by-step through the process of creating a sales forecast workflow and building a dashboard to visualize the results using MarkovML's automation flows.
By the end of this tutorial, you will have a business flow and functional dashboard to visualize your sales forecasts and be able to replicate the steps easily with your own data.
Let's get started!
Step 1: Upload Sales Forecast Data
Before you can forecast sales, you need to provide the data that the AI will use. MarkovML supports several ways to add data to your workflow, including from local files (CSV), Google Sheets, and databases like PostgreSQL, S3, or Snowflake, and more.
For this tutorial, we will use sample data, which is pre-uploaded to help you explore and test the flow before you use your real data. You could also use the sample data to present your ideas(the workflow you build) to the team. Follow the steps below to add your data to the workflow.
Add Your Data File to the Workflow:
-
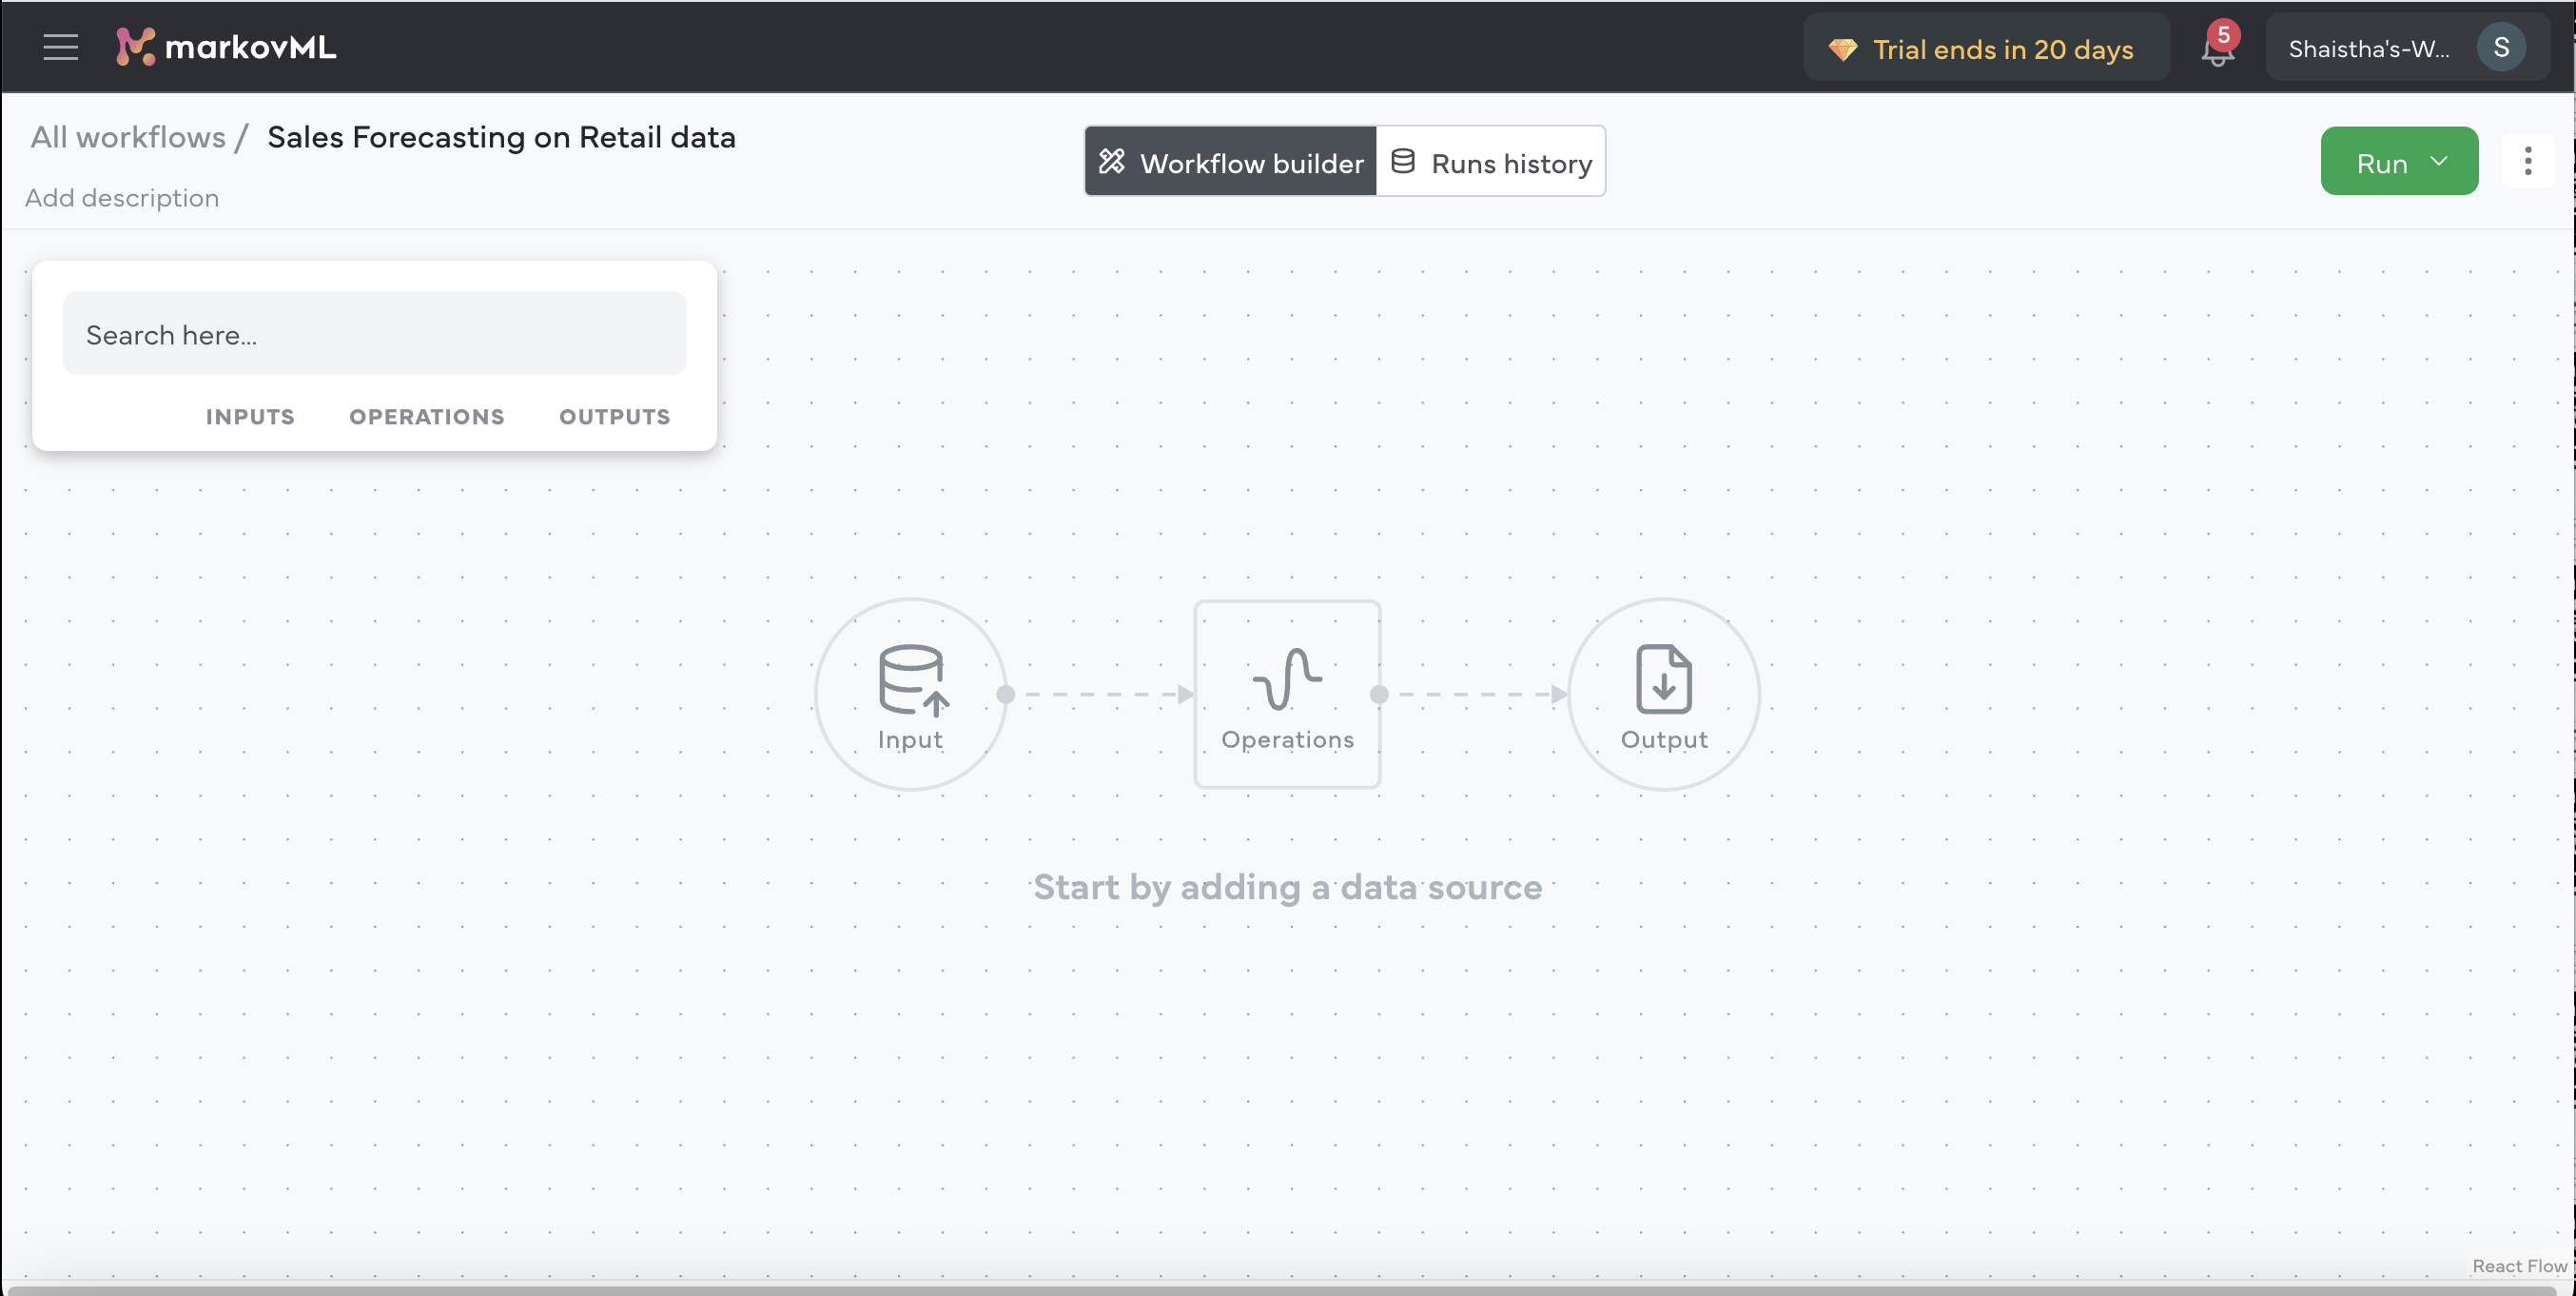
On the Builder Flow page, click on the left floating bar with Inputs / Operations / Outputs.
-
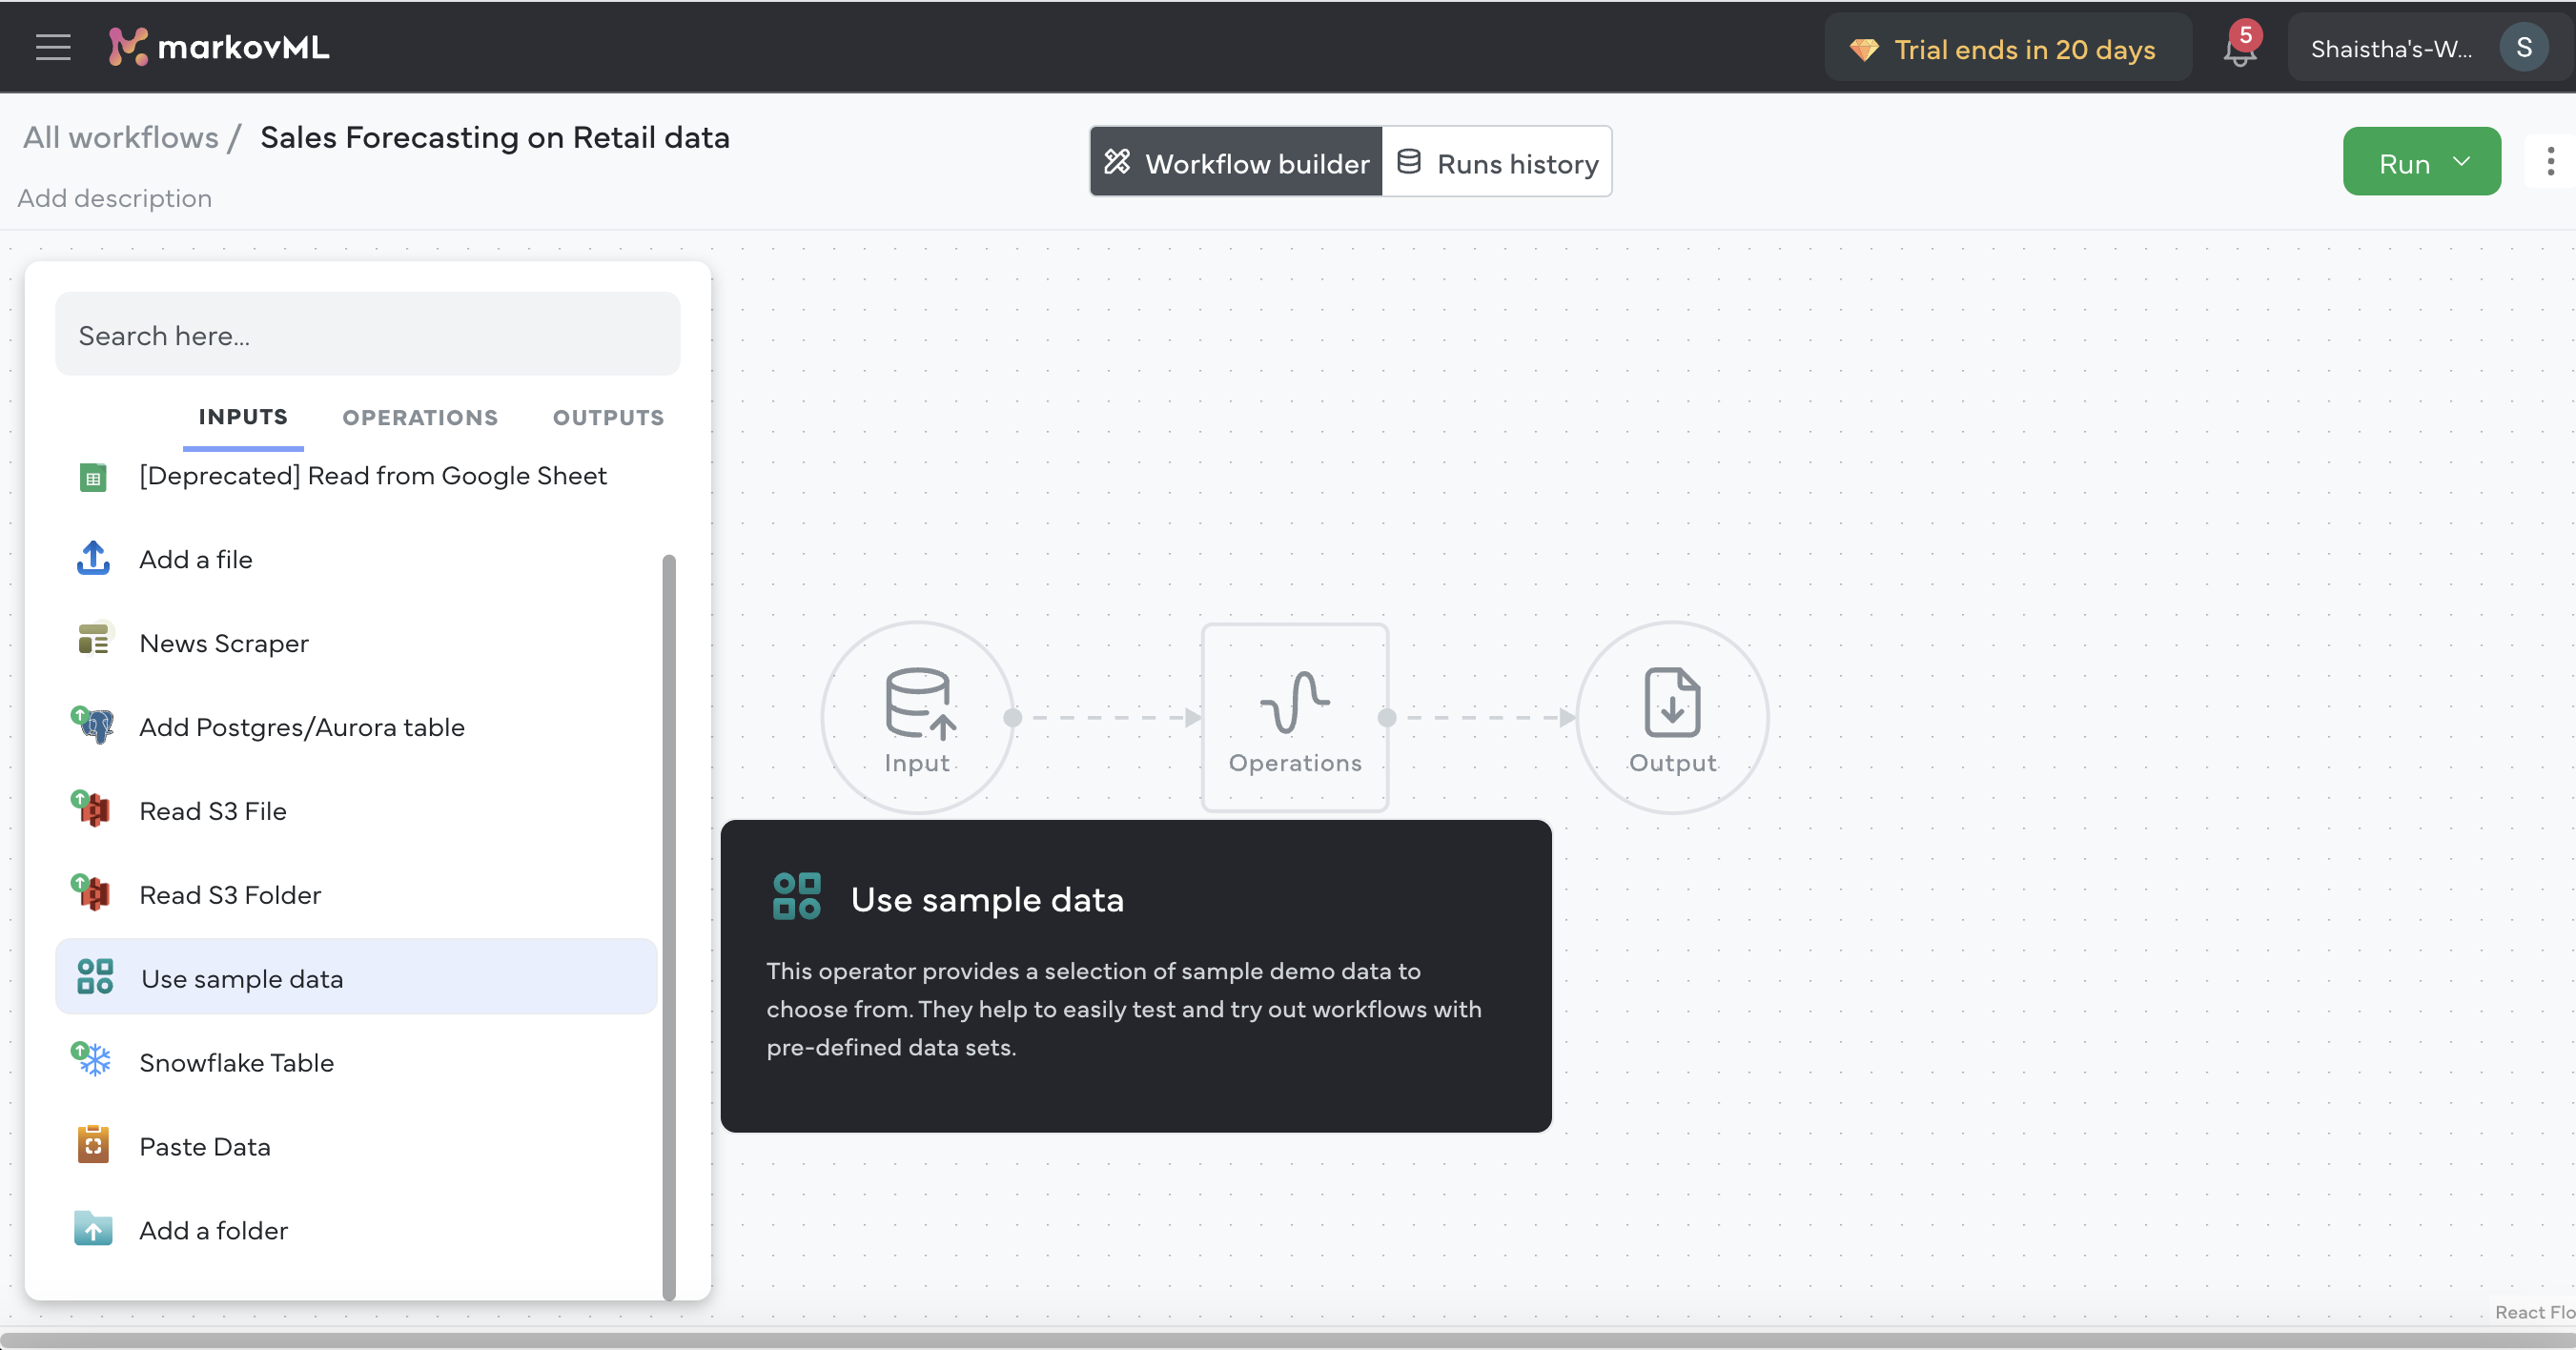
Click on INPUTS and select Use sample data.
-
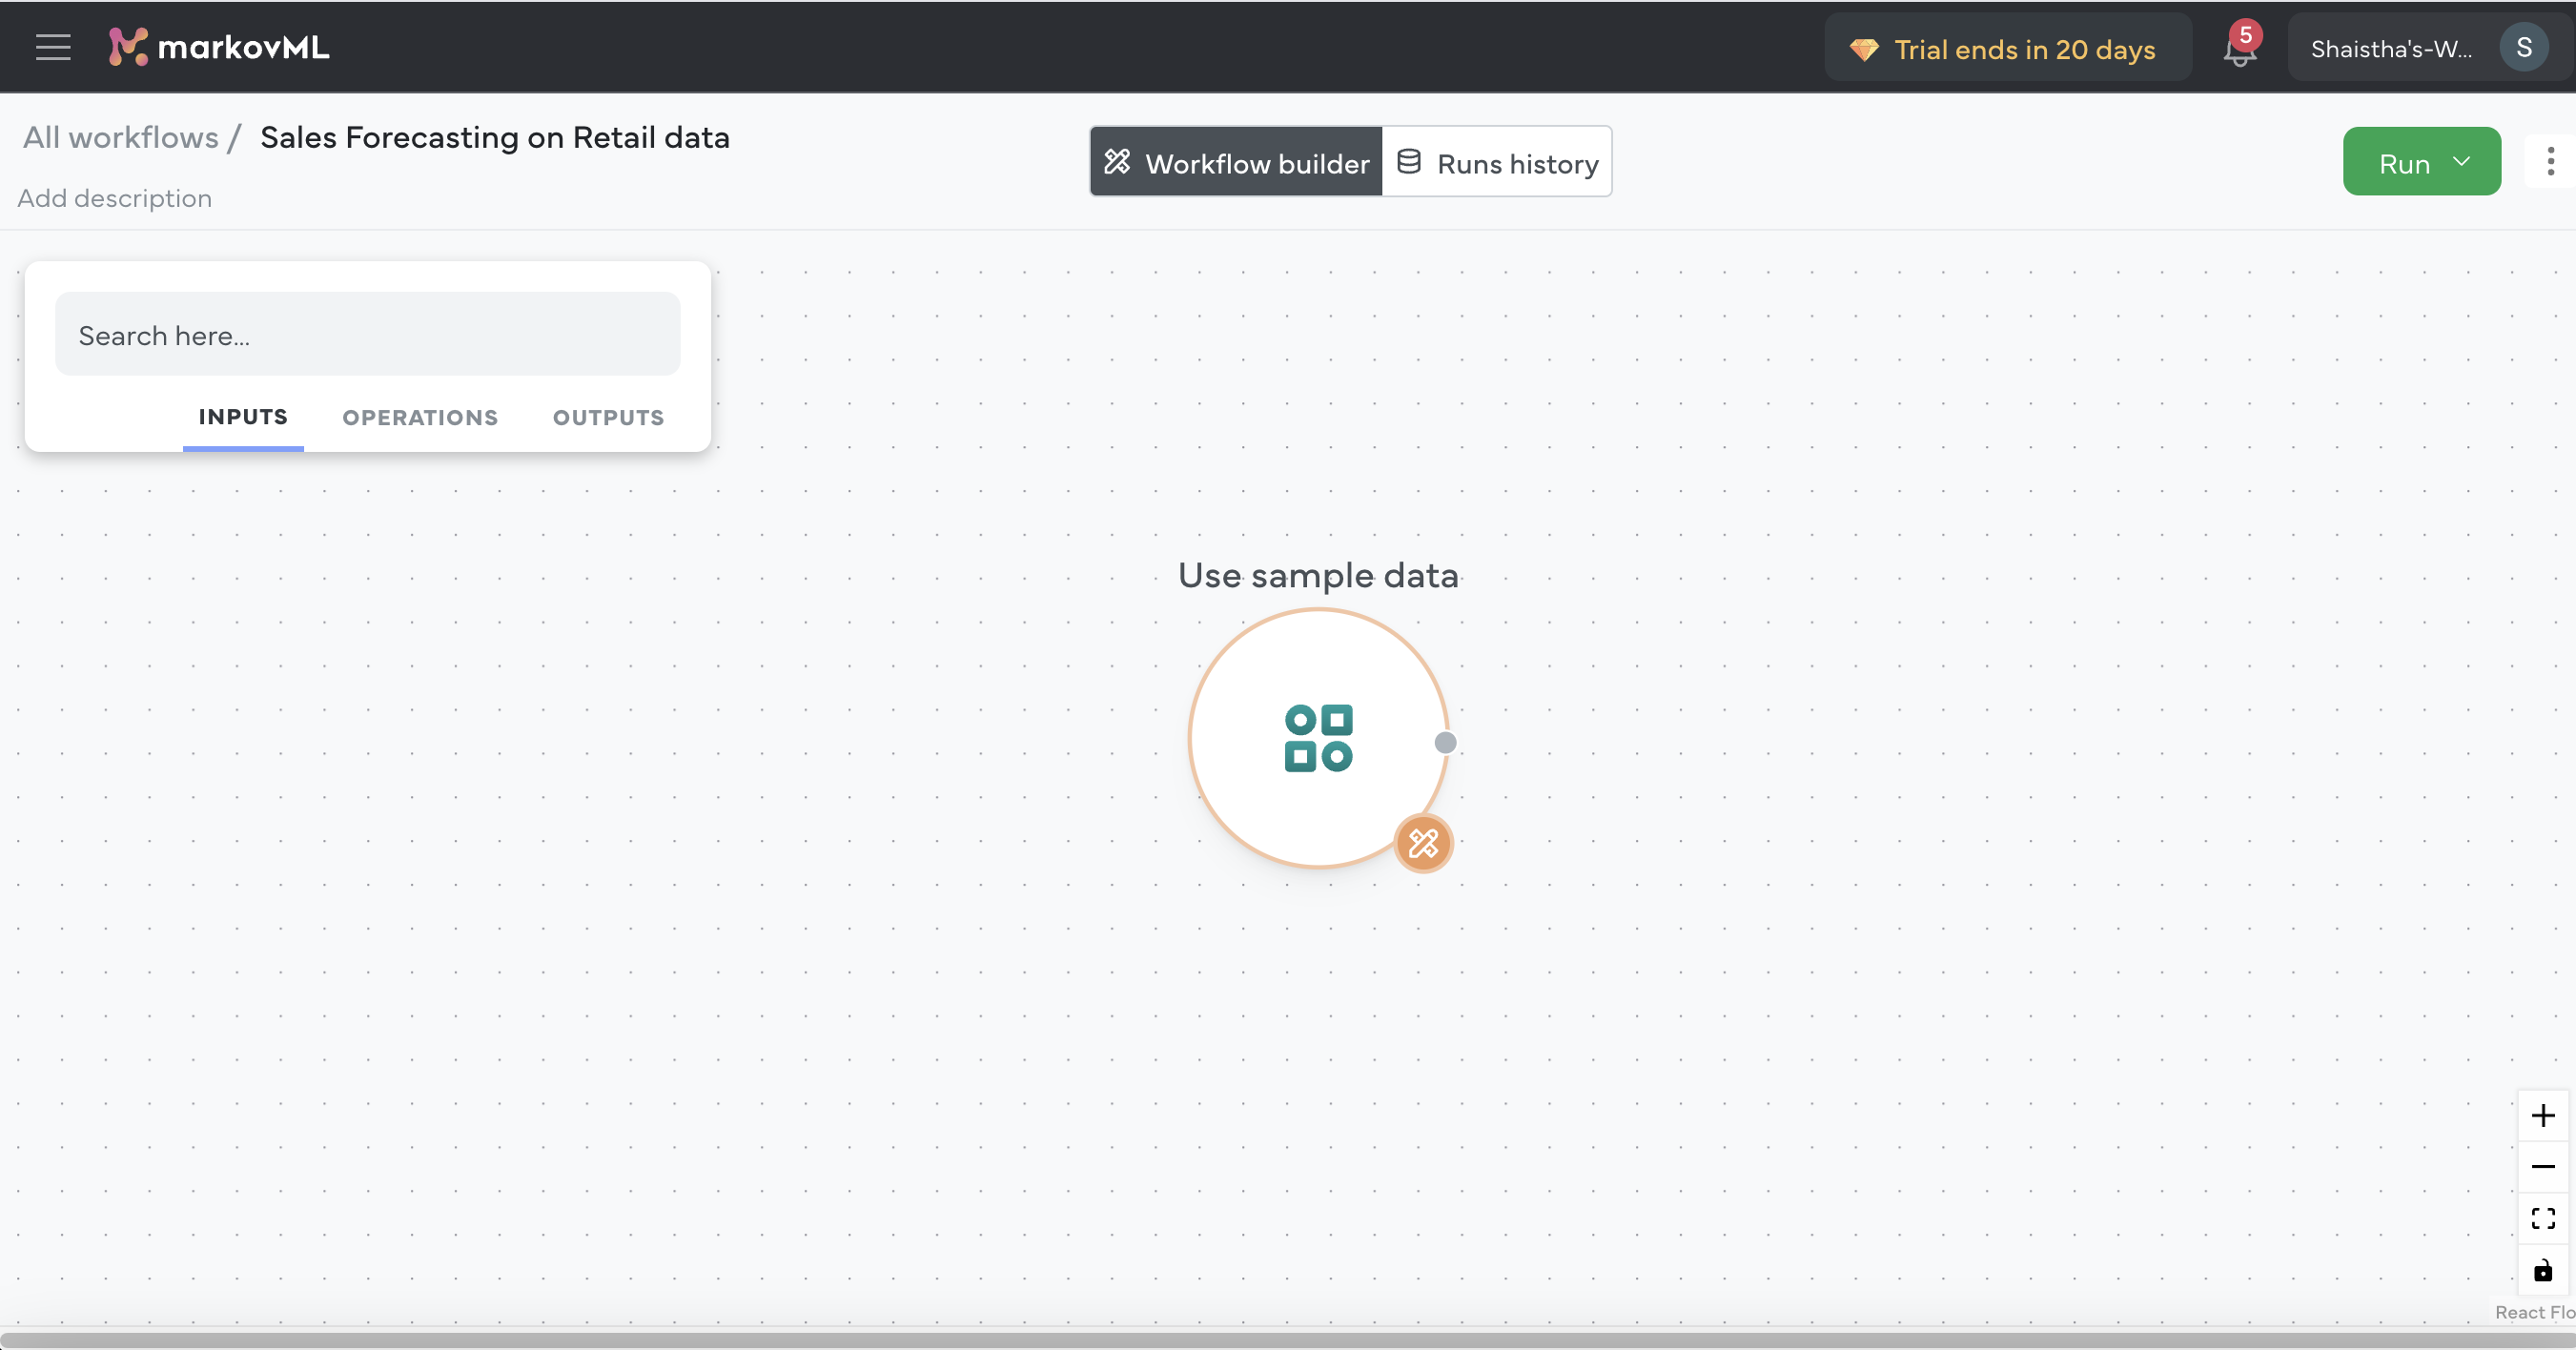
This will add the Use sample data input block to the workflow builder page, as shown in the image below.
-
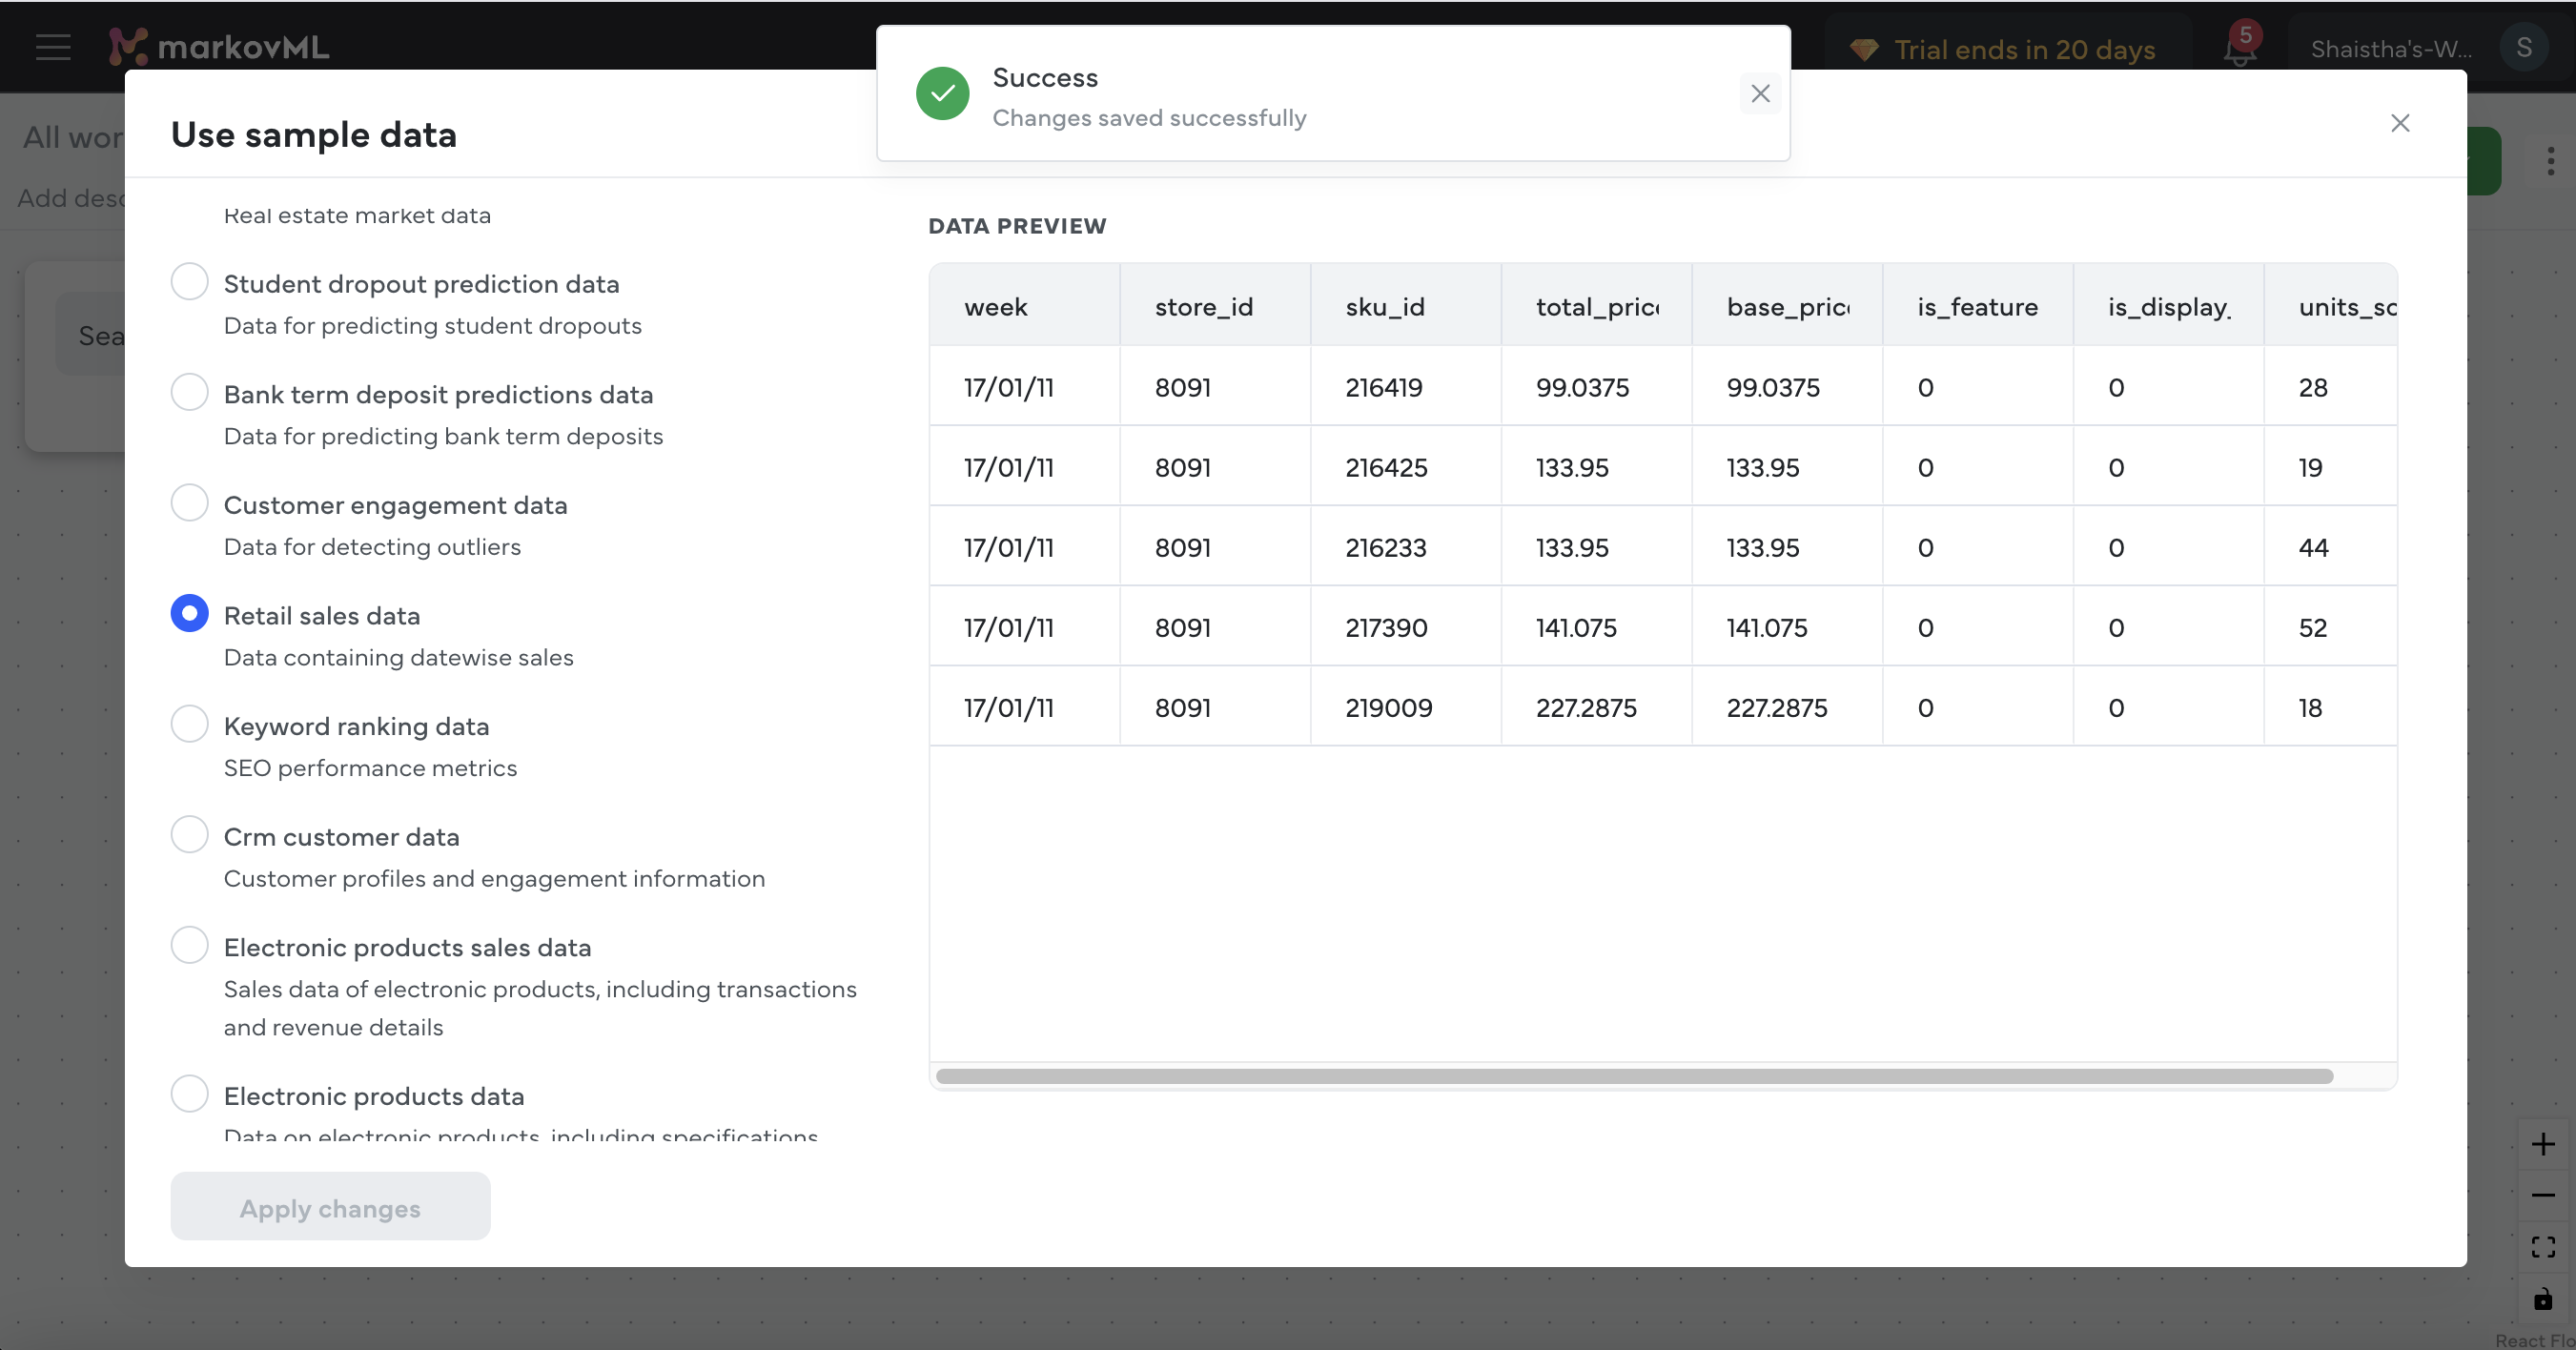
Click on it or the pen icon to edit and add input data. This will open a pop-up. Choose the Retail sales data and then click Apply changes button. Once you do this, you will be able to see a preview of the dataset you chose, as shown below. This will help you understand the structure and content before you proceed.
Step 2: Choose the Right Operations
Now that your data is ready, it's time to decide what kind of operation you want to perform on it. MarkovML offers various categories of operations, including:
| Category | Description |
|---|---|
| Text Data Operations | A collection of processes for text-based data in tables. |
| Numeric Operations | A range of functions for numeric data in tables. |
| Table Structuring Operations | Tools for managing and organizing table data. |
| LLM Operations | A set of LLMs to perform AI-powered tasks. |
| LLM Operations | Specialized functions for training models and performing AutoML. |
| Multimedia & Document Operations | Operations for processing various document types and media formats. |
| Data Enrichment Operations | Enhance your datasets by integrating additional information and context. |
| Web Scraping Operations | Operations specifically designed to enrich business data. |
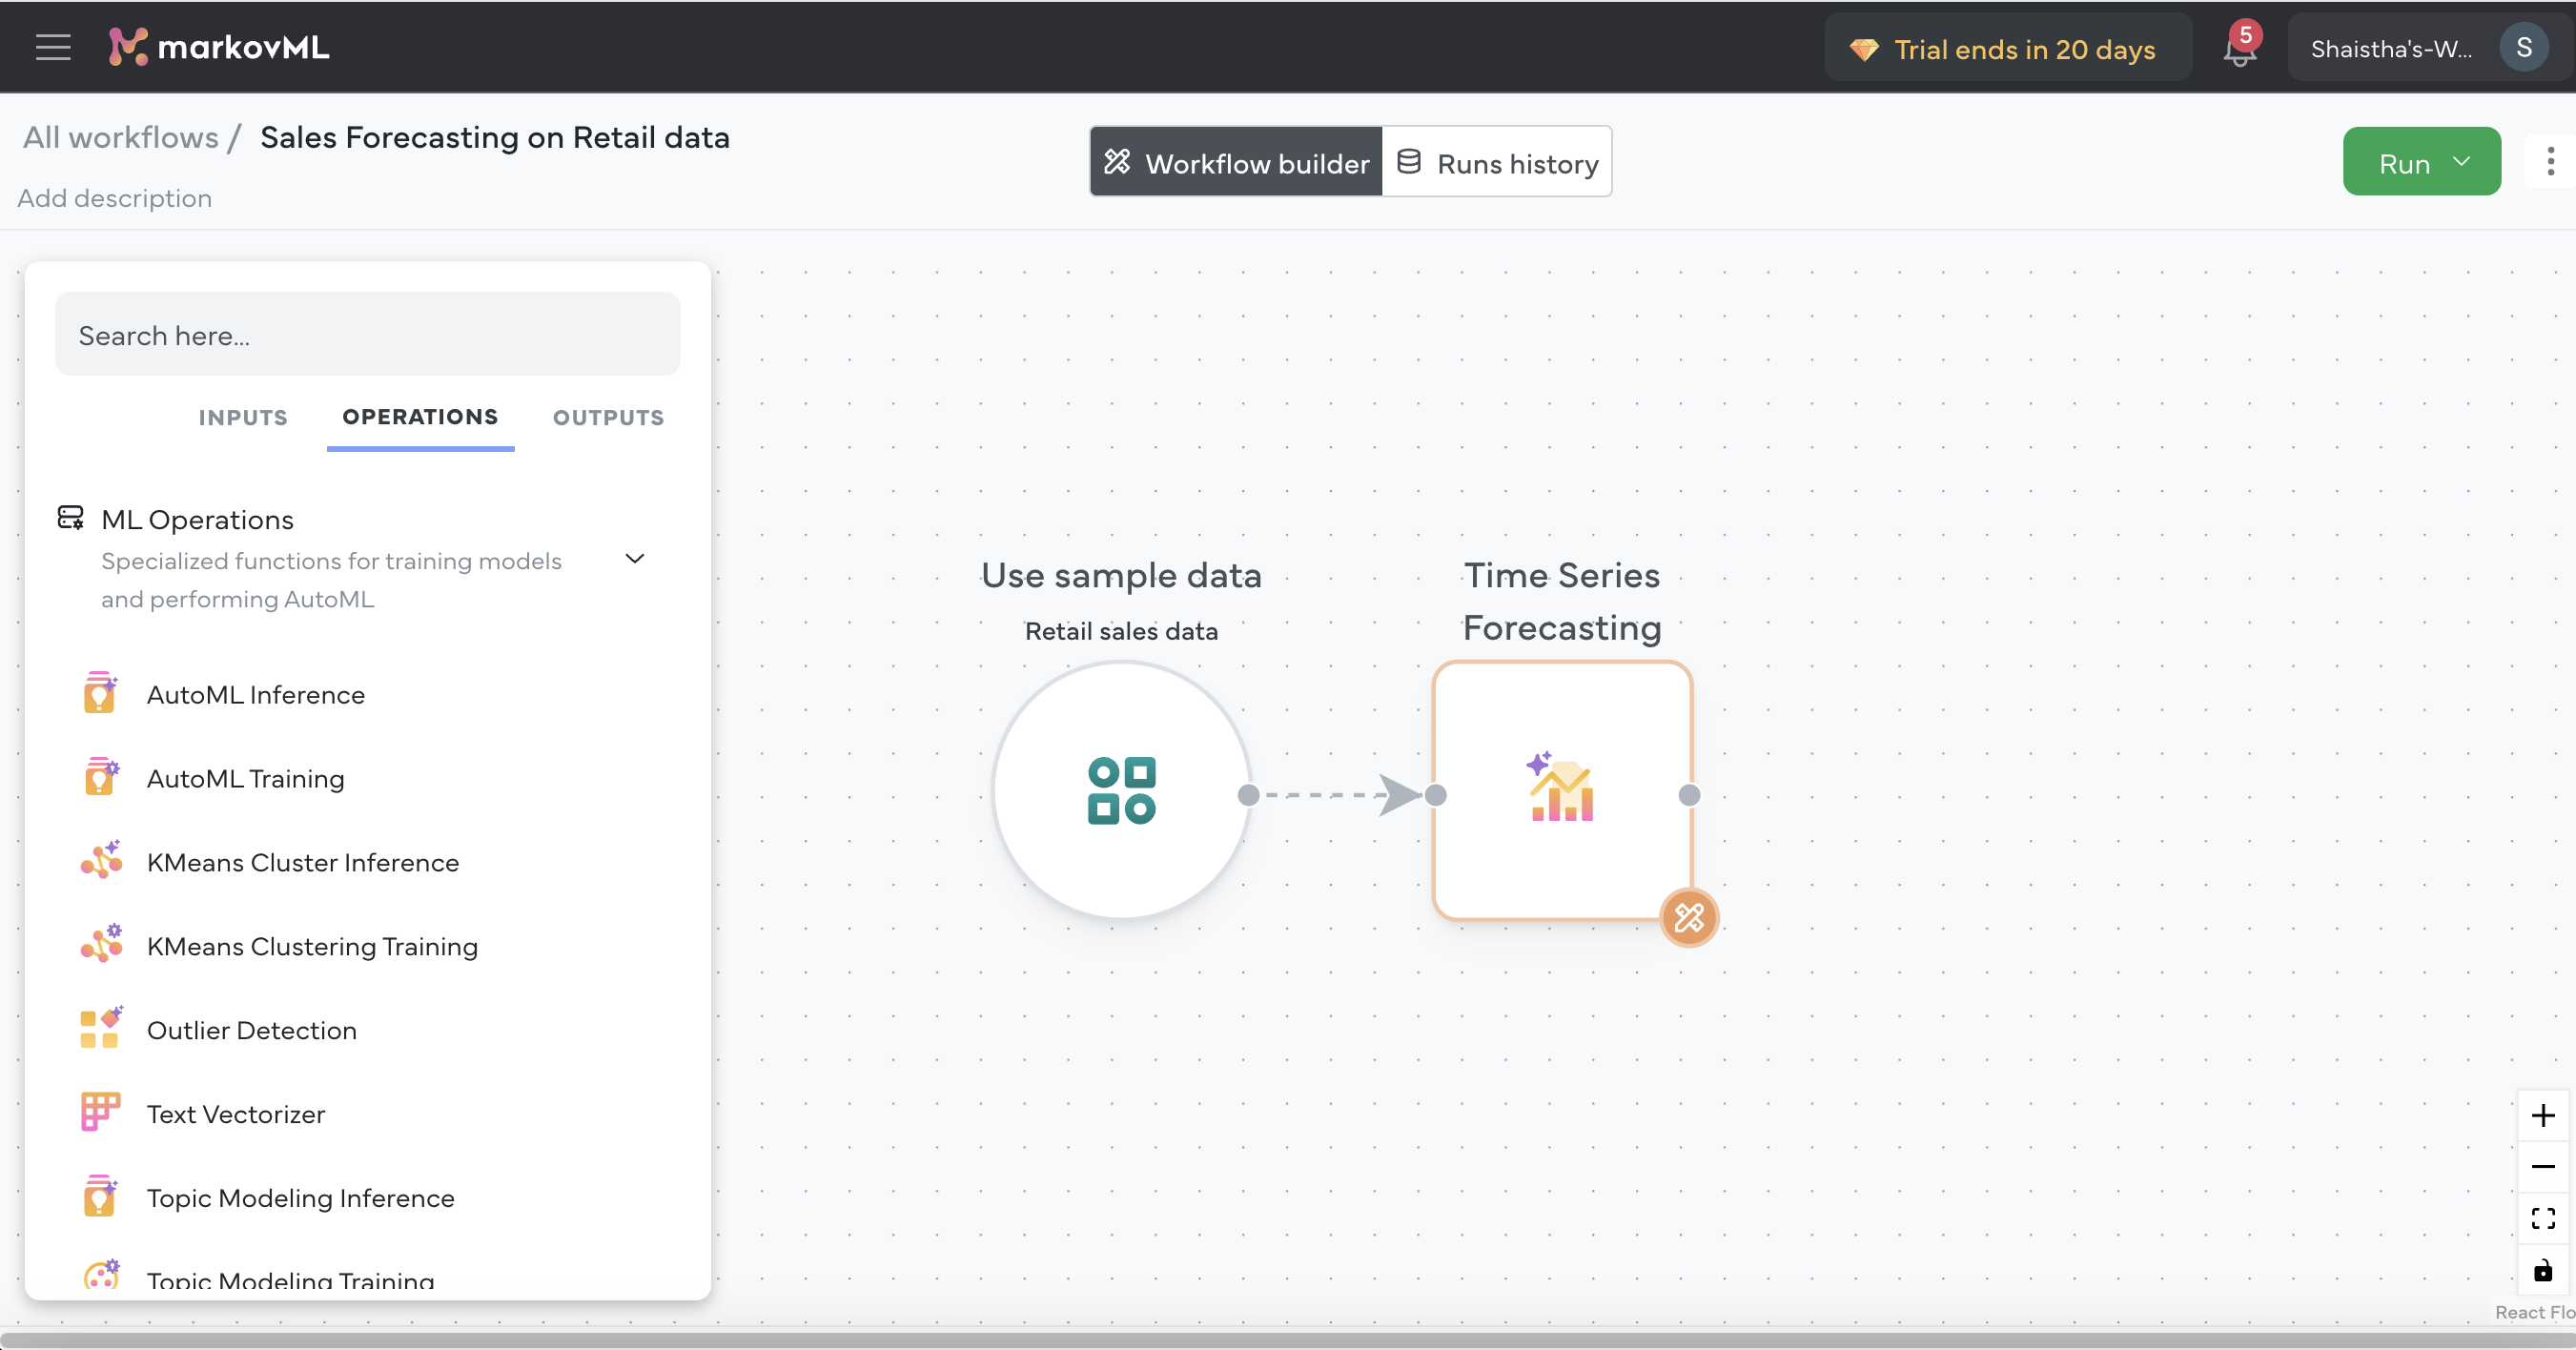
For this tutorial, click on the ML Operations category and choose the Time Series Forecasting operationto predict future sales.
Add the Operation:
-
In the operations section, click on ML Operations and select Time Series Forecasting.
-
This will automatically connect the operation to the input operator you set earlier, as shown below.
Set Up Your Sales Forecasting Parameters
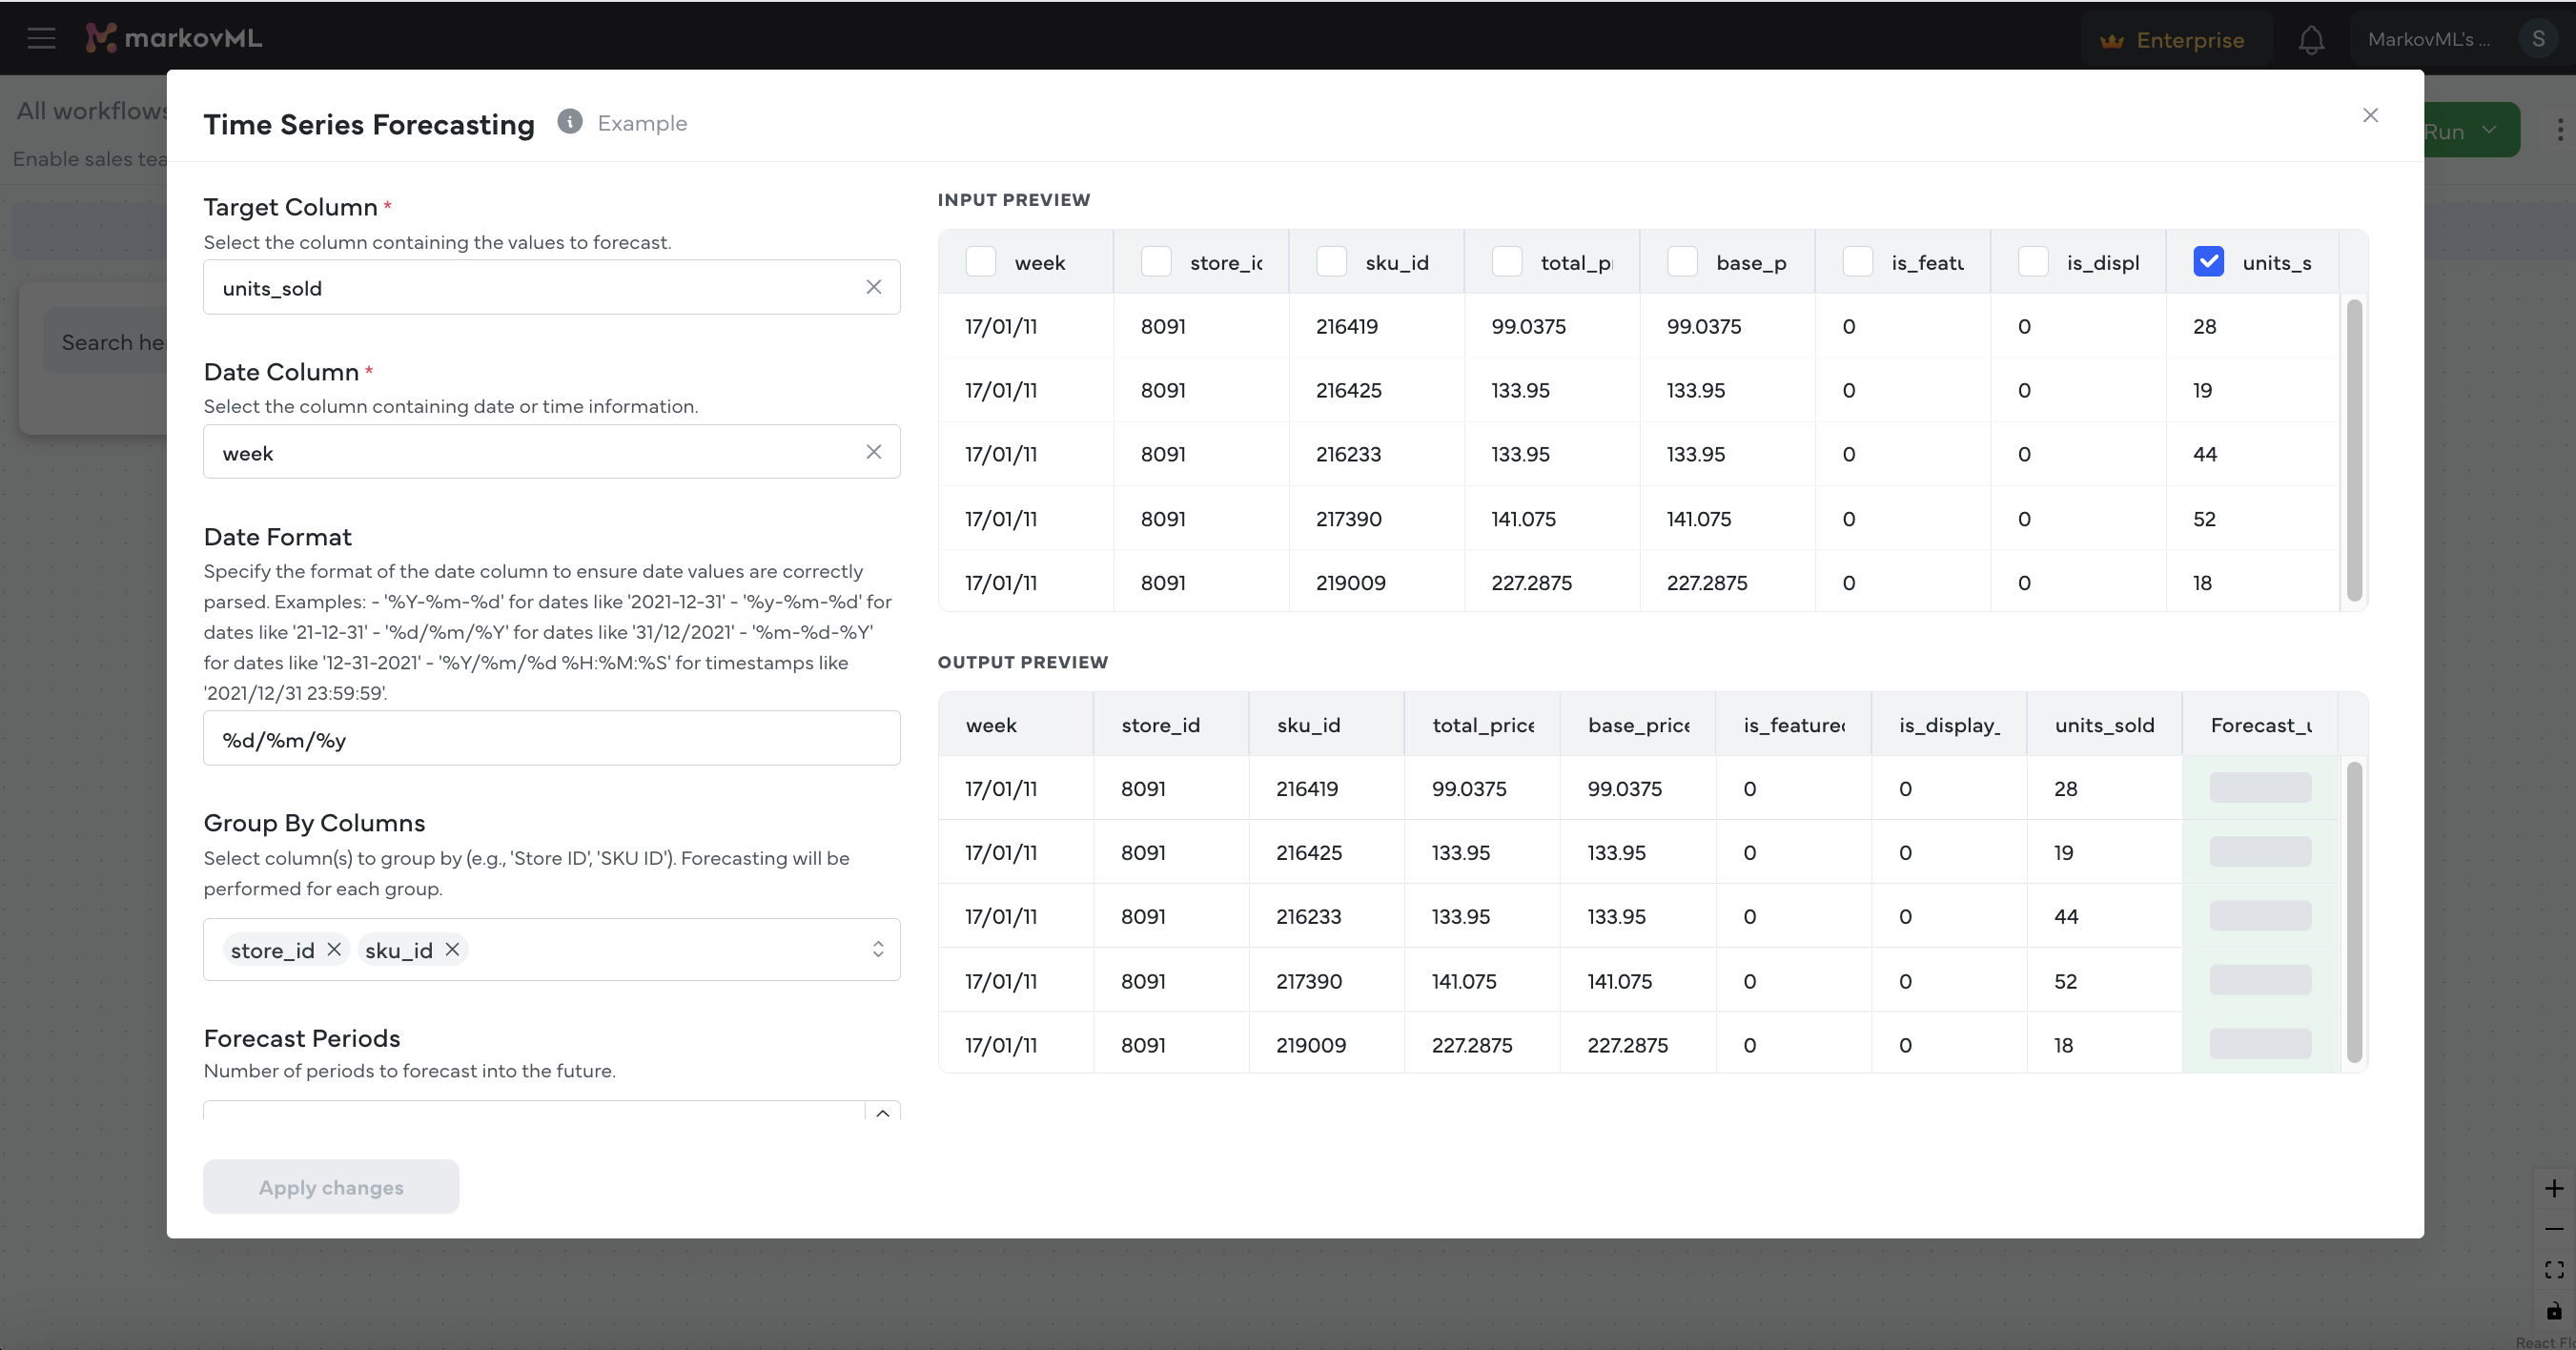
Now, let’s configure the forecasting operation. When you click on the Time Series Forecasting operation, a pop-up will appear, allowing you to set the necessary parameters.
Set the Following
- Target Column:
units_sold(this is the column you want to predict) - Date Column:
week(this tells the system which column contains date info) - Date Format:
%d/%m/%y(set the format for the date, which is Day/Month/Year) - Group By Columns:
store_id;sku_id(this means you want forecasts grouped by store and product) - Forecast Periods:
10(this will predict sales for the next 10 periods) - Frequency:
Daily(set the prediction frequency) - Growth Type:
logistic(use logistic growth for more realistic sales projections) - Holiday Country:
US(this helps adjust forecasts based on U.S. holidays)
Once all fields are filled in, hit Apply Changes button to confirm the setup.
Step 3: Add an OUTPUT to Store the Results
After setting up your operation, you will want to store the results somewhere. In MarkovML, you can choose from various output options, just like inputs.
To Save Your Forecast:
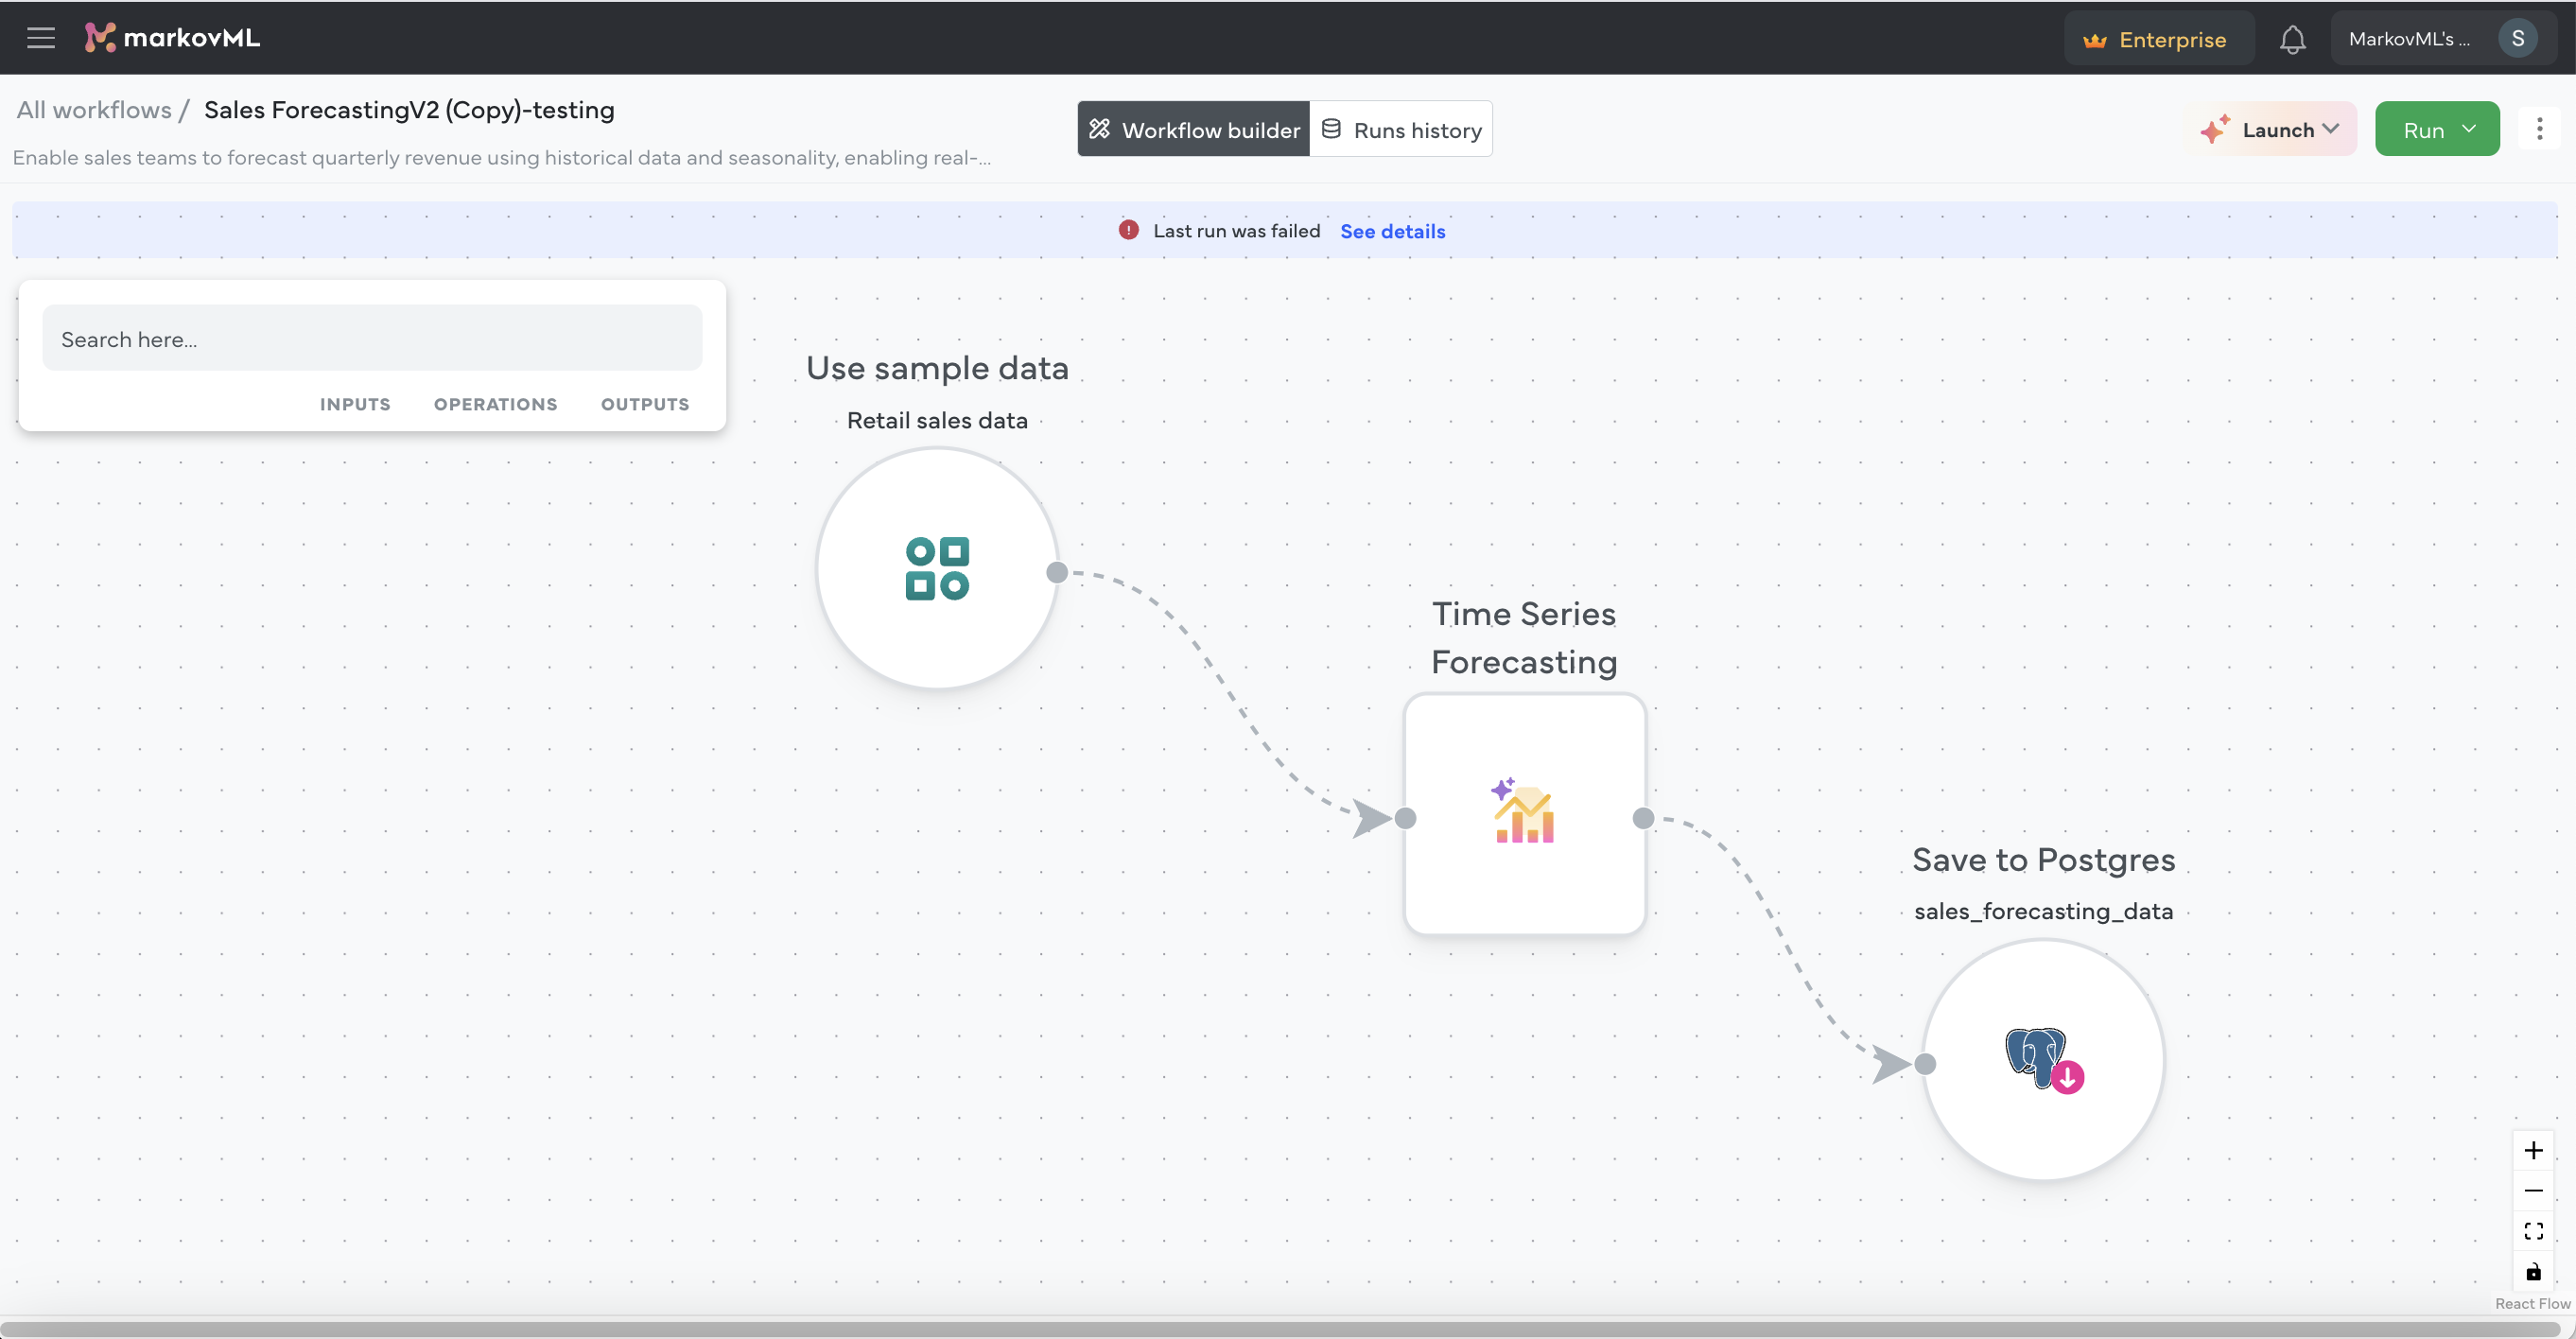
- Click on Outputs from the floating bar and choose Save to Postgres. This will automatically connect it to your workflow, as shown below.
- In the pop-up, click Add New, which will prompt you to either select an existing connector or add a new one. If you are adding a new connector, fill in the required details like your database host, port, and other credentials.
After saving, your workflow is now complete and ready to run.
Step 4: Run the Workflow
With everything set up, it’s time to run your workflow and generate the forecast. Just click the Run button, and the system will process the data and return the results.
NoteDon’t forget to lock your workflow to prevent any further changes by your team members after it’s ready to go. Check "How to lock and unlock your workflow?"
Step 5: Launch the Dashboard
To launch a dashboard, click the Launch button on the top-right corner. From the dropdown select Visualization dashboard.
NoteDashboards don’t automatically get created, someone has to manually create them.
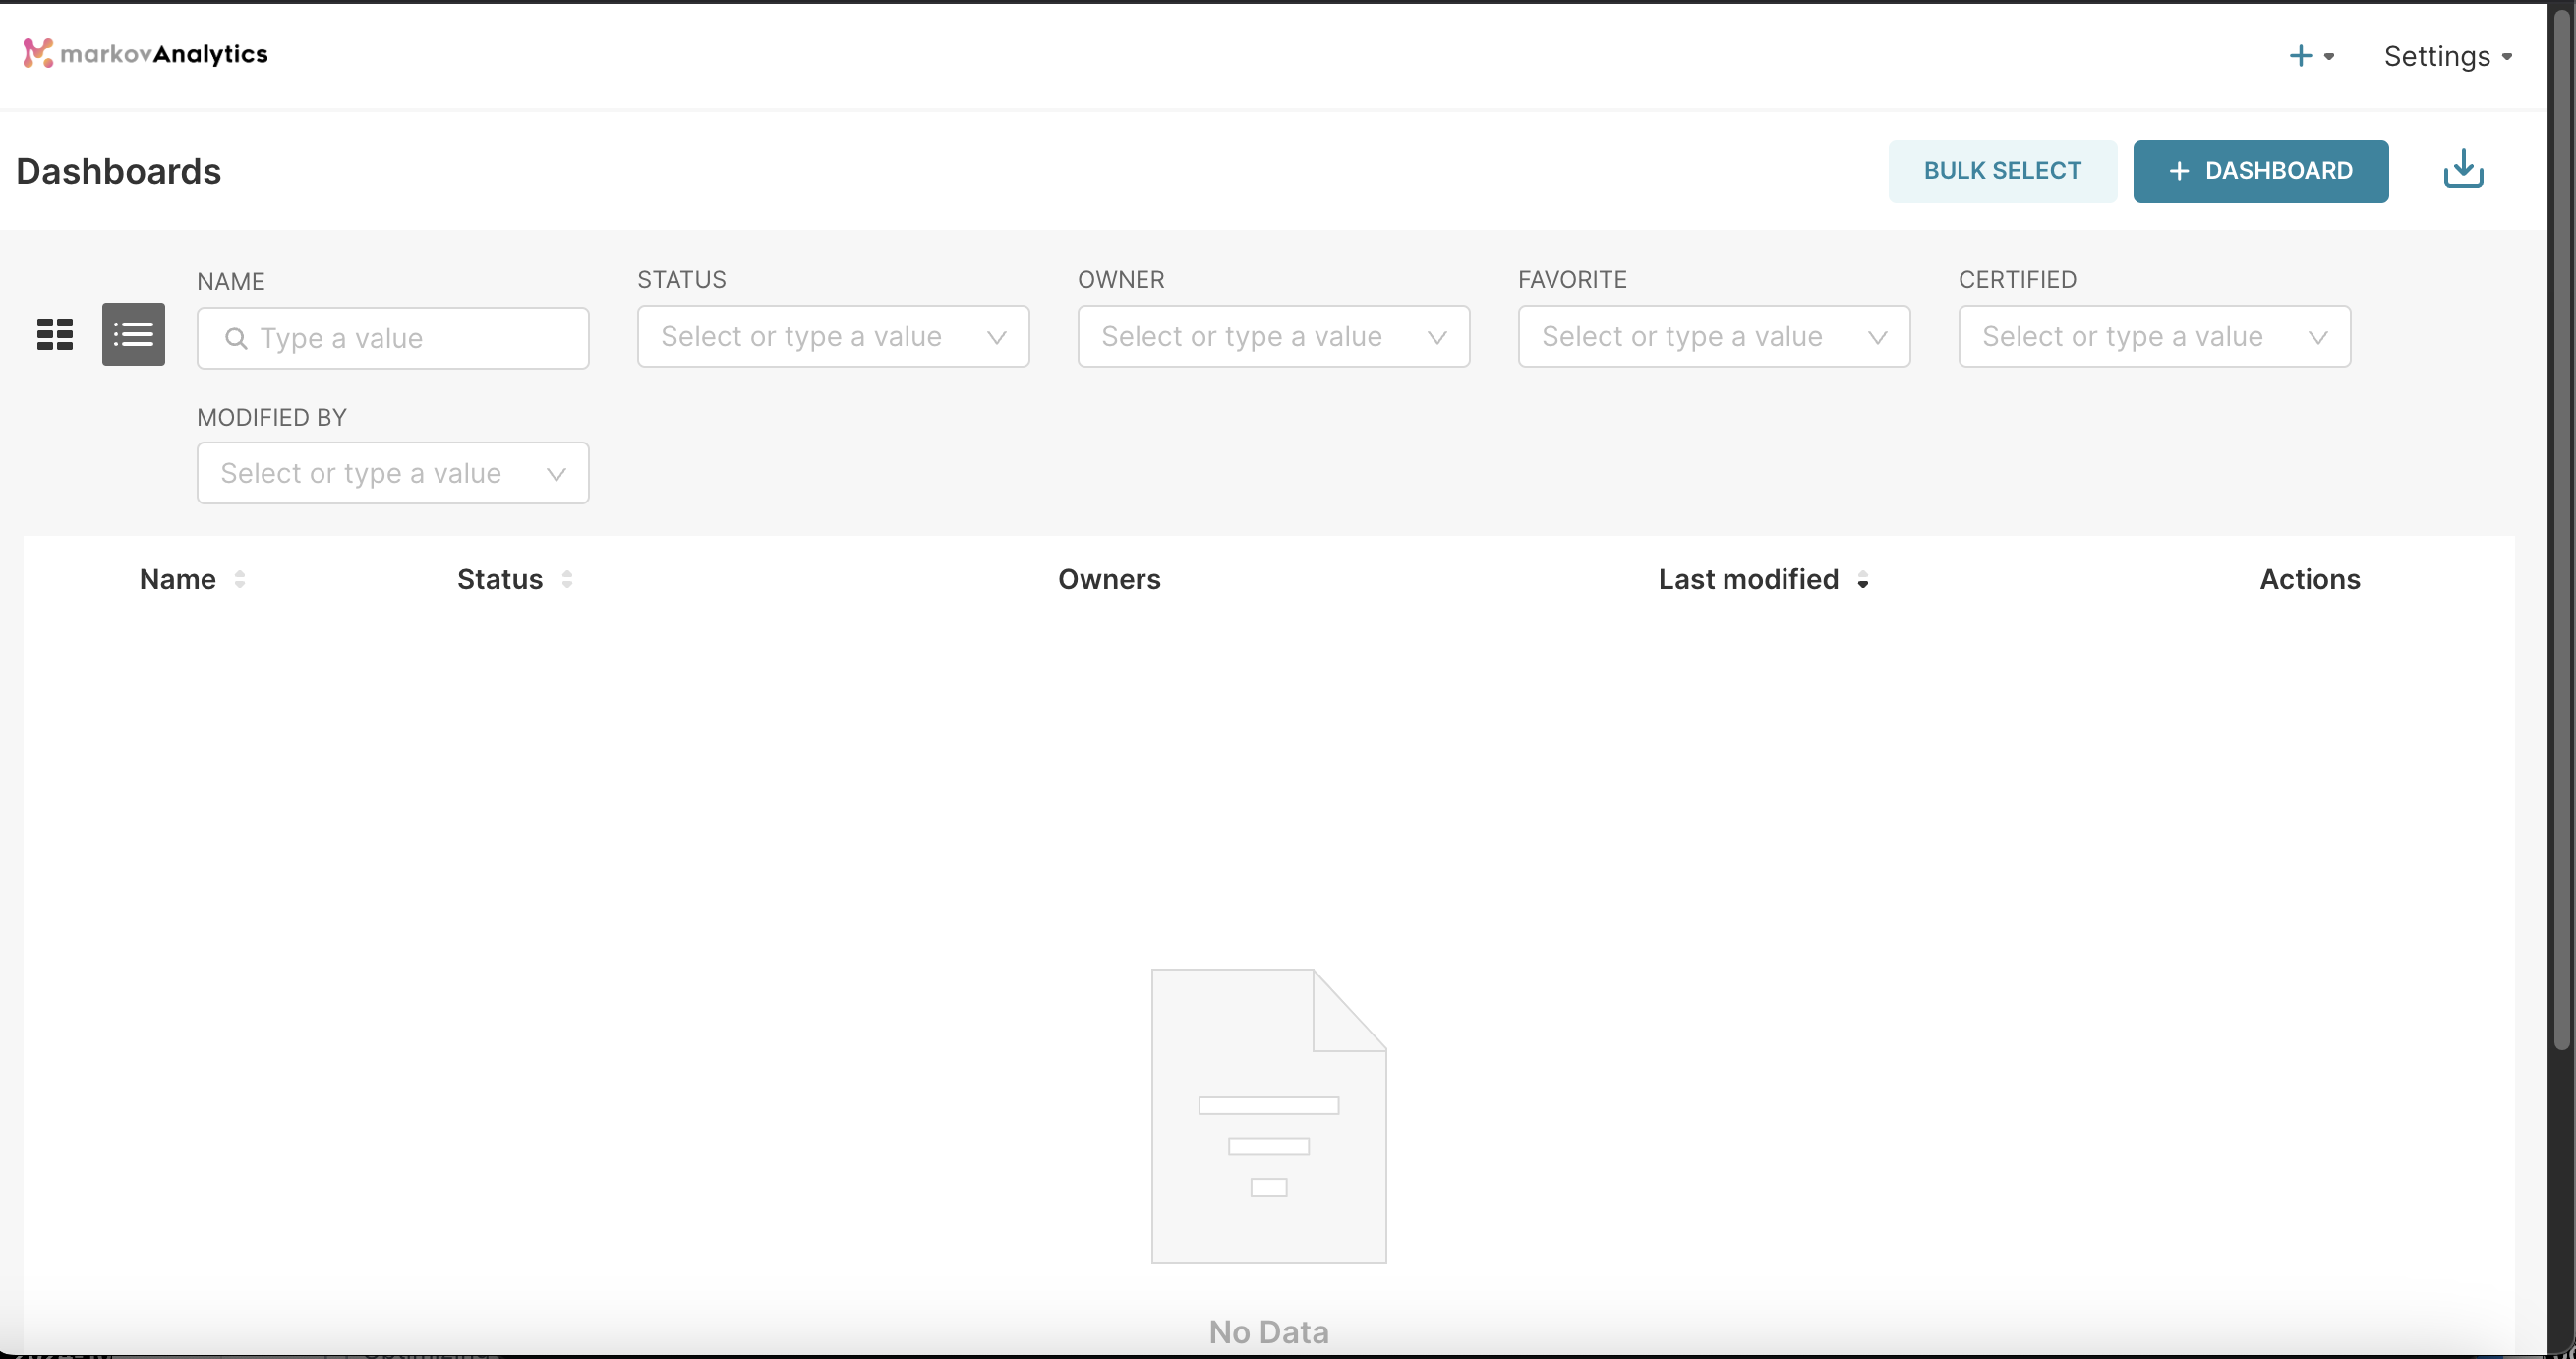
This will open a new page as shown below. From here, you can start building your dashboard, click on the
+ DASHBOARD button to get started.
Dashboard page
Start Building your Dashboard
In the new page, as shown below, you may start building your dashboard by creating new charts. To get started, click on the Create a new chart button below. And pick the type of chart you want to build and follow along.
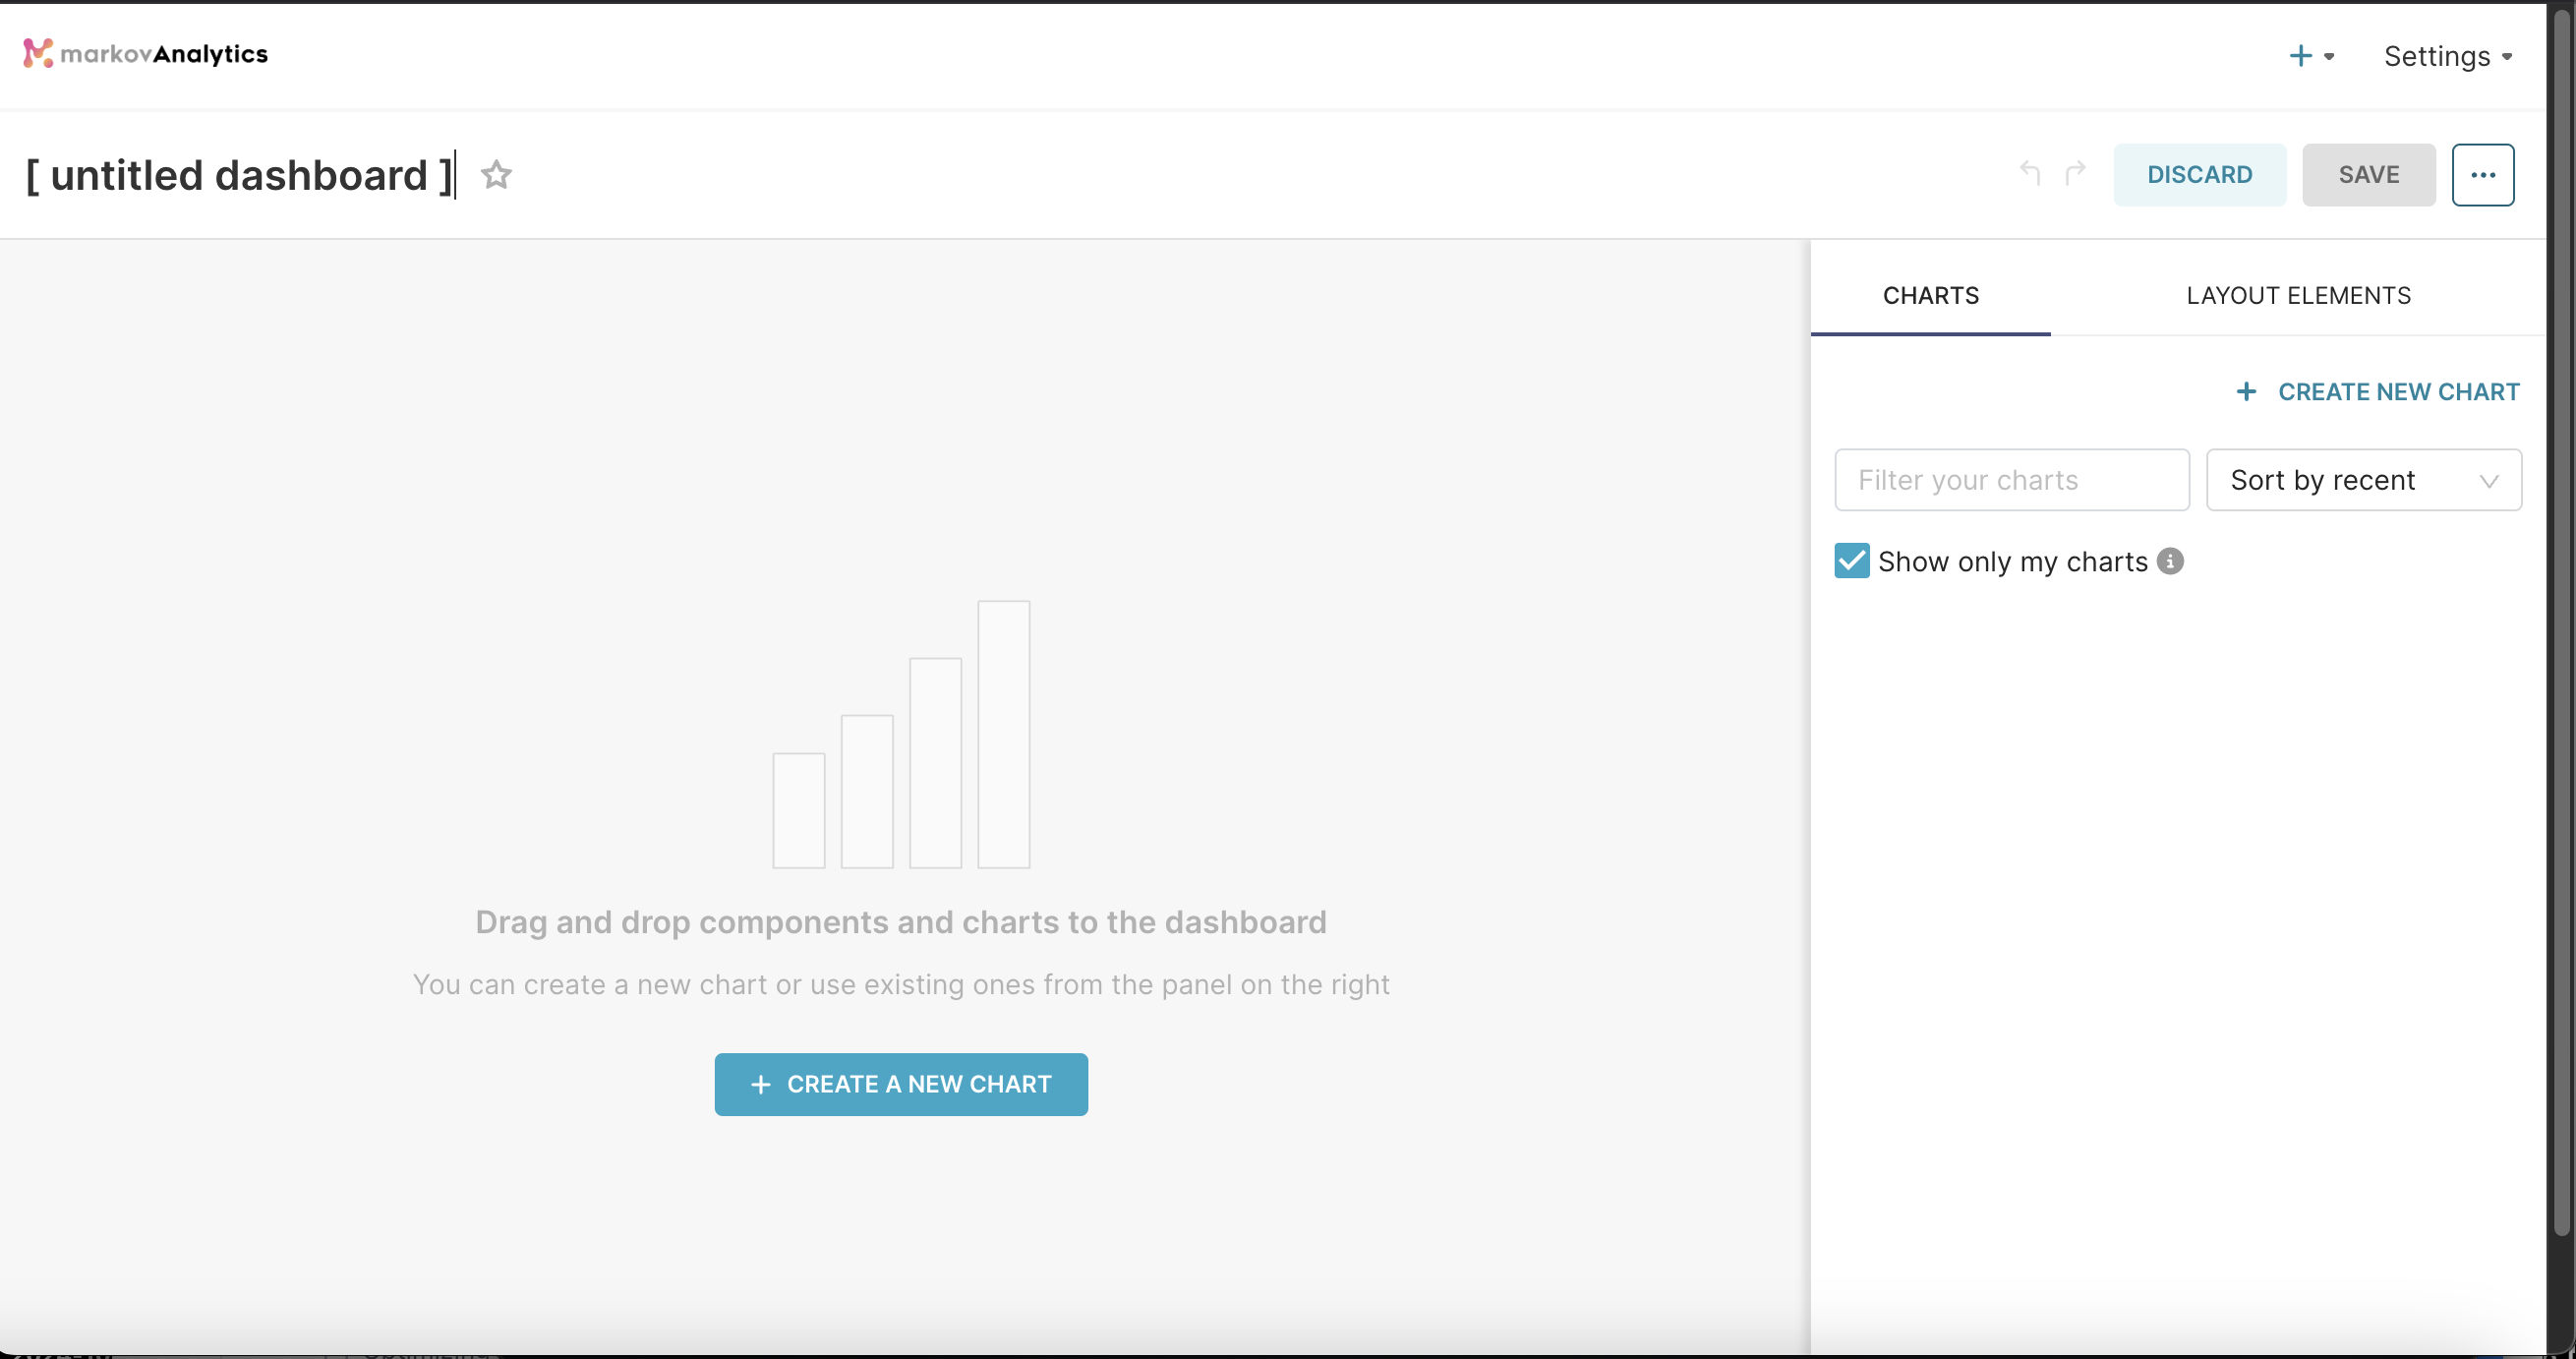
Start building your dashboard
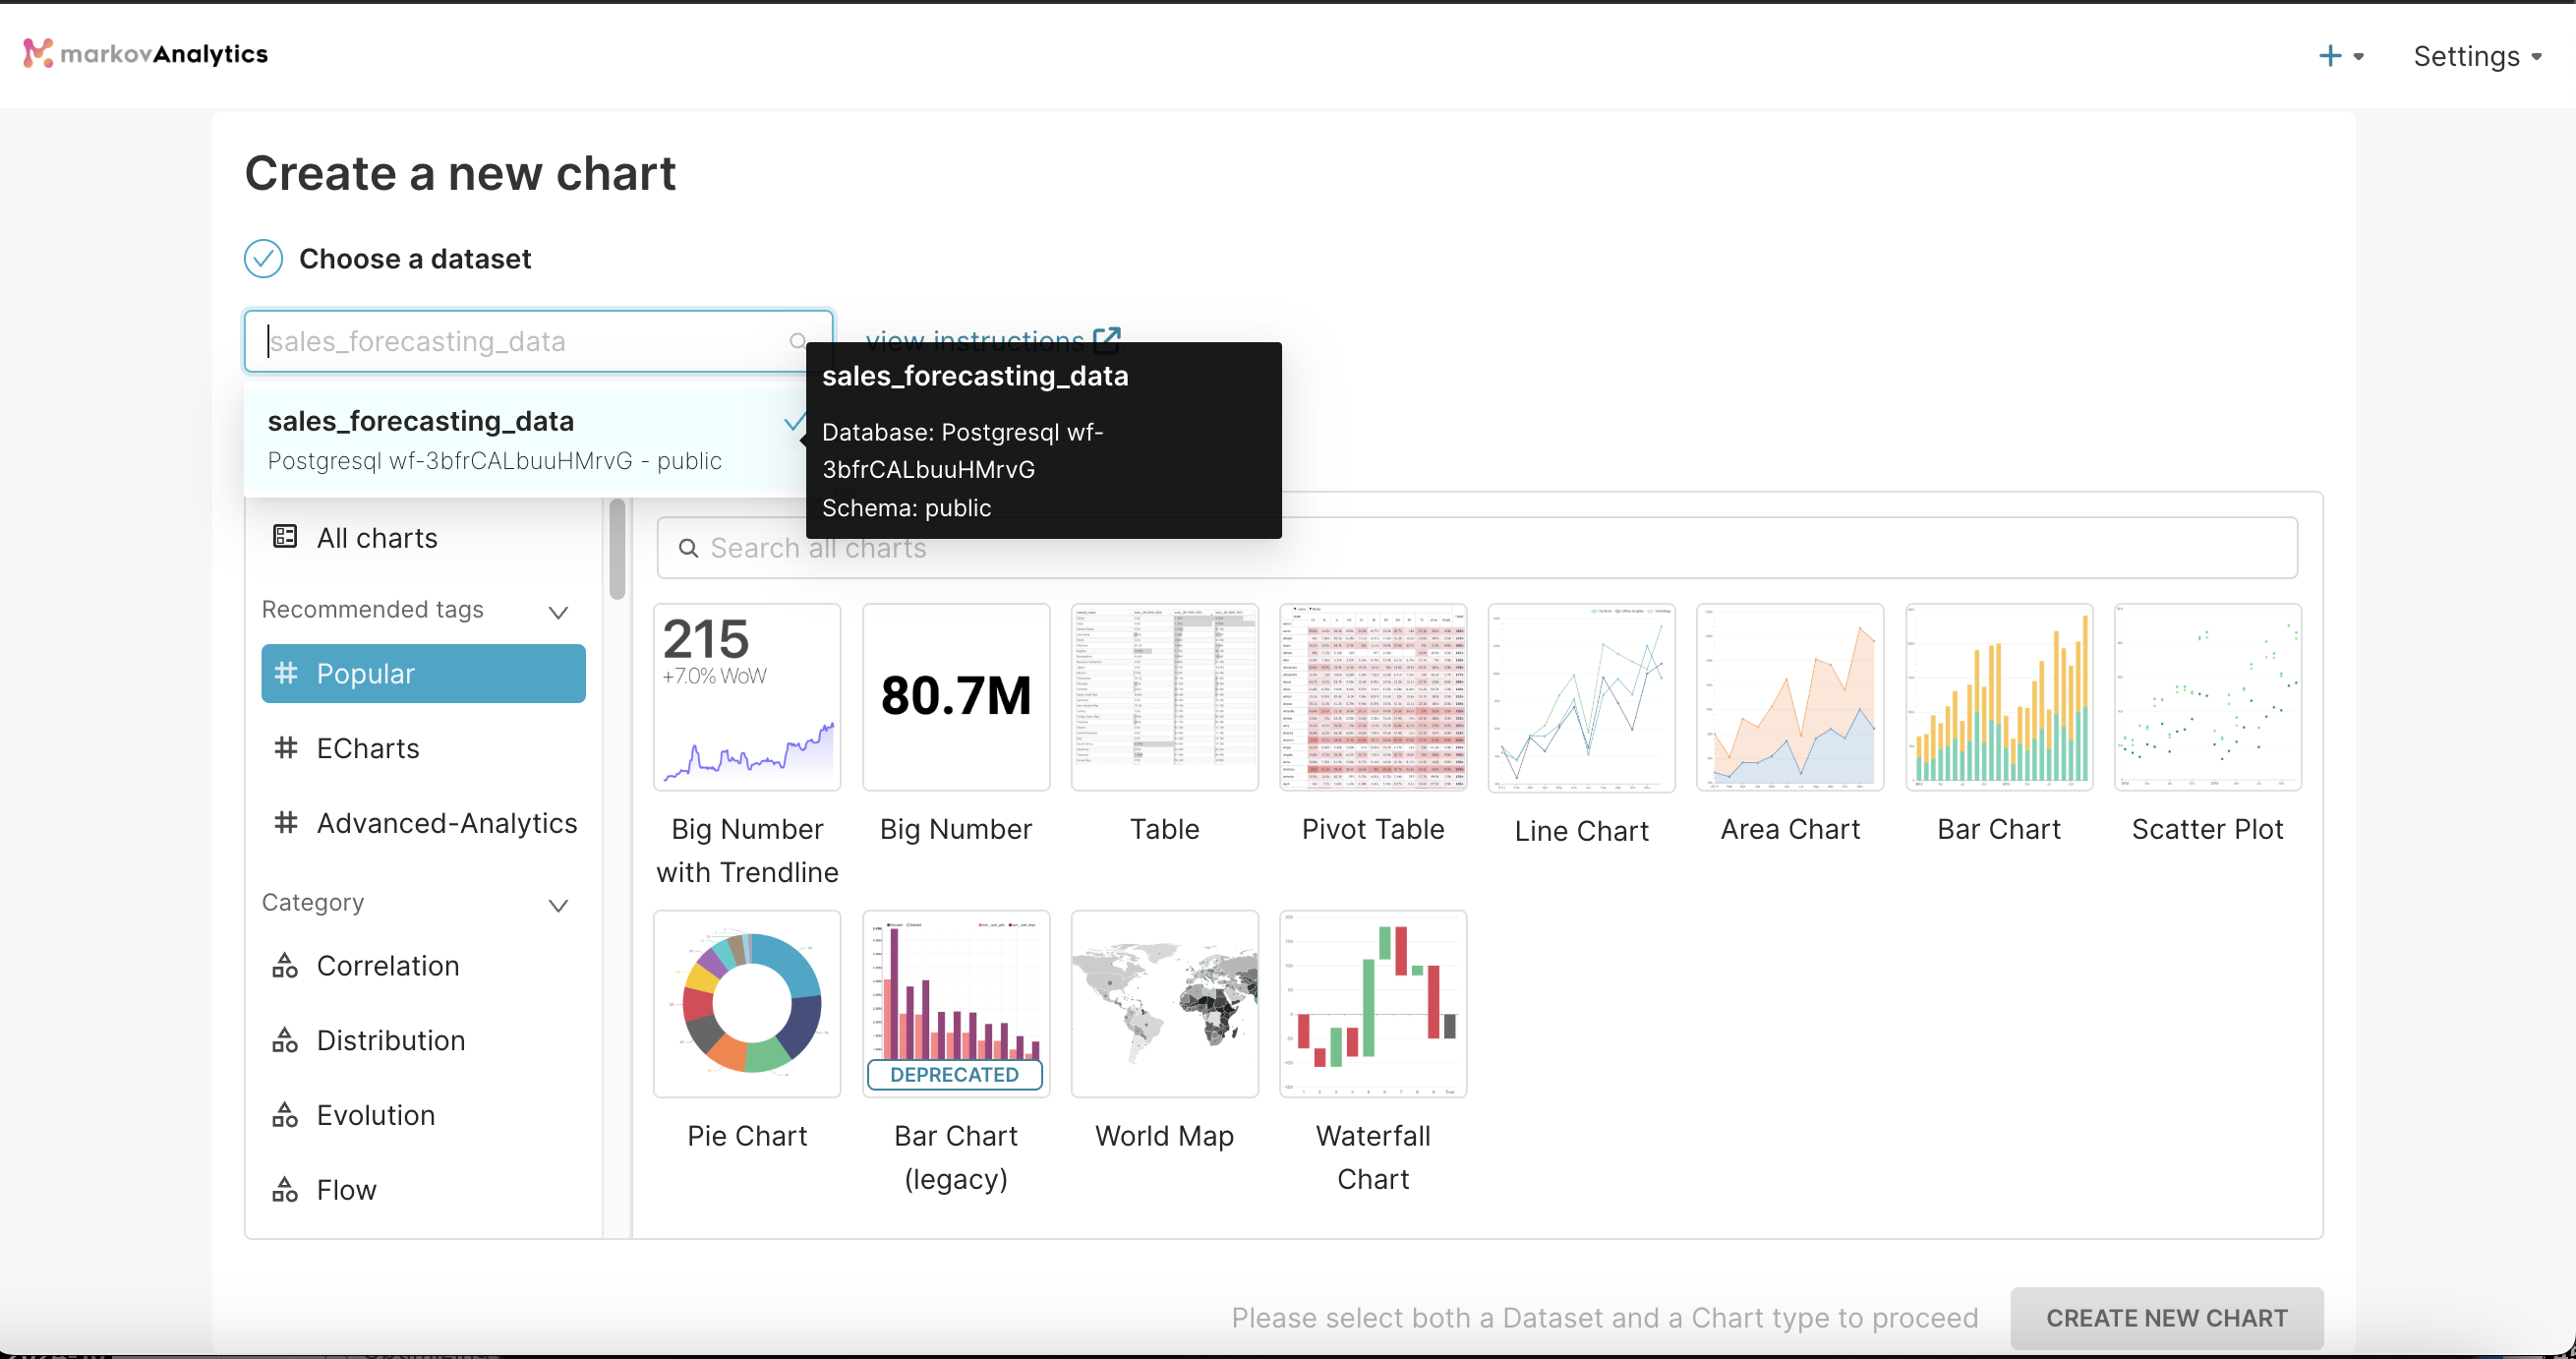
Choose the dataset and select the chart you want to build
The final chart is shown below. For a detailed guide on creating your own dashboard, explore this link.
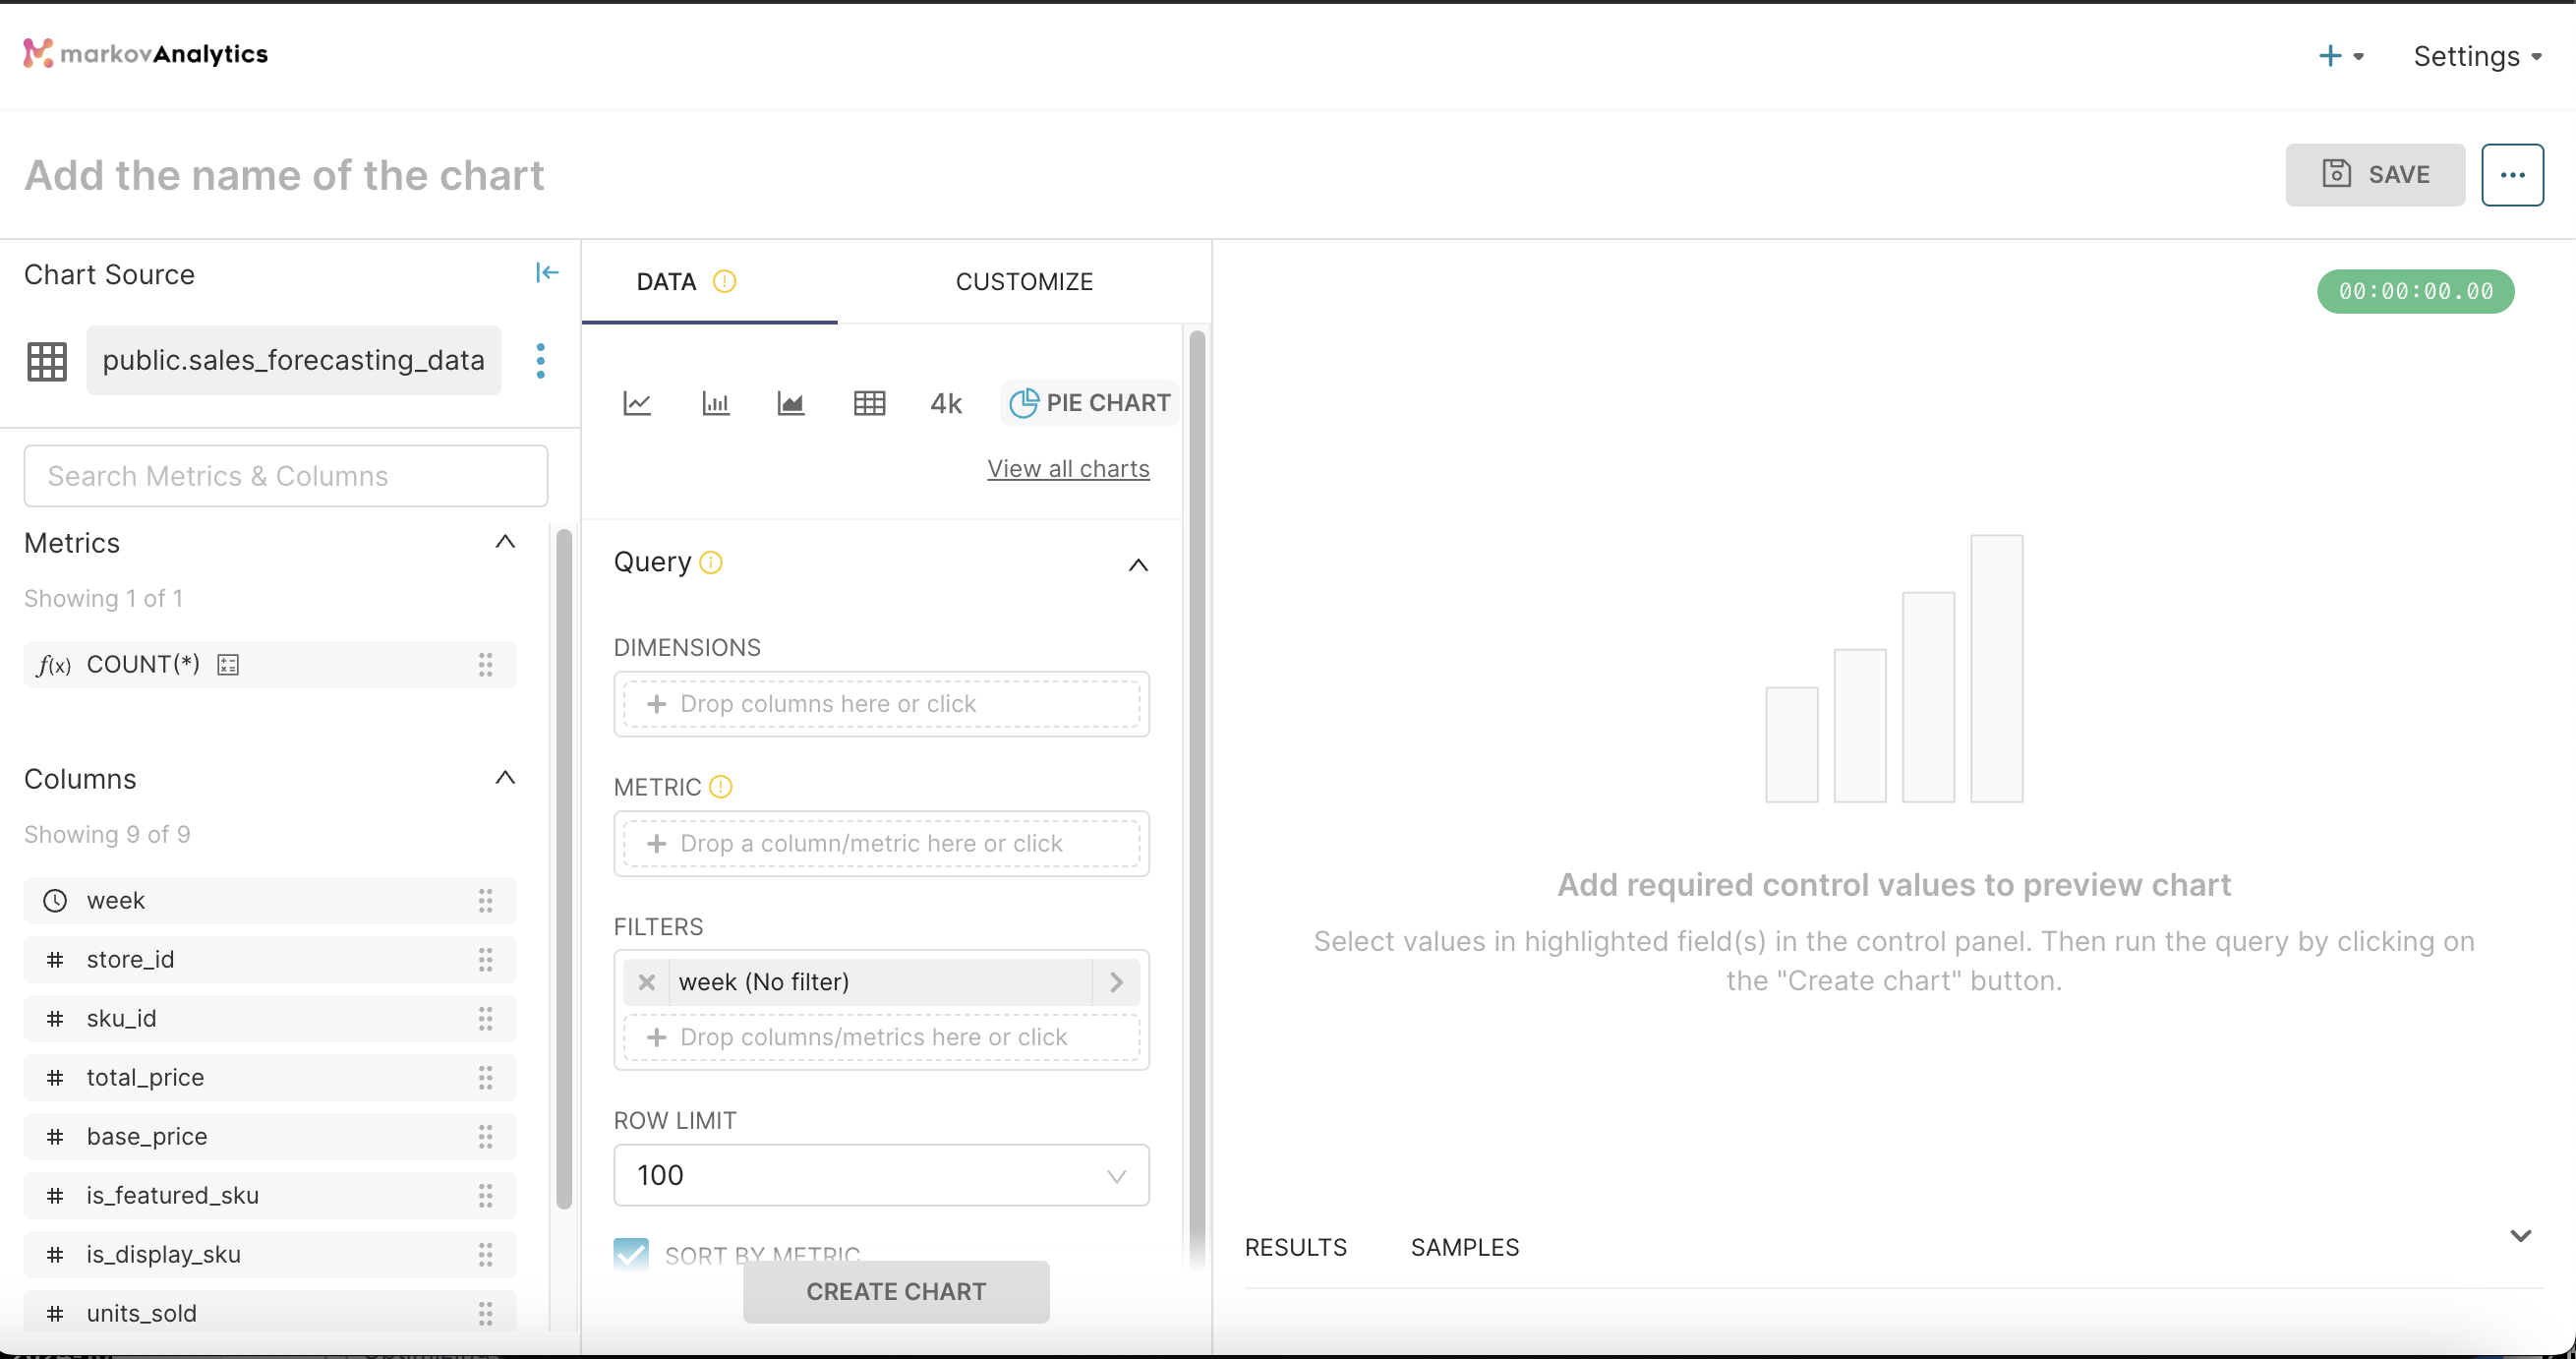
Customize and build analysis chart
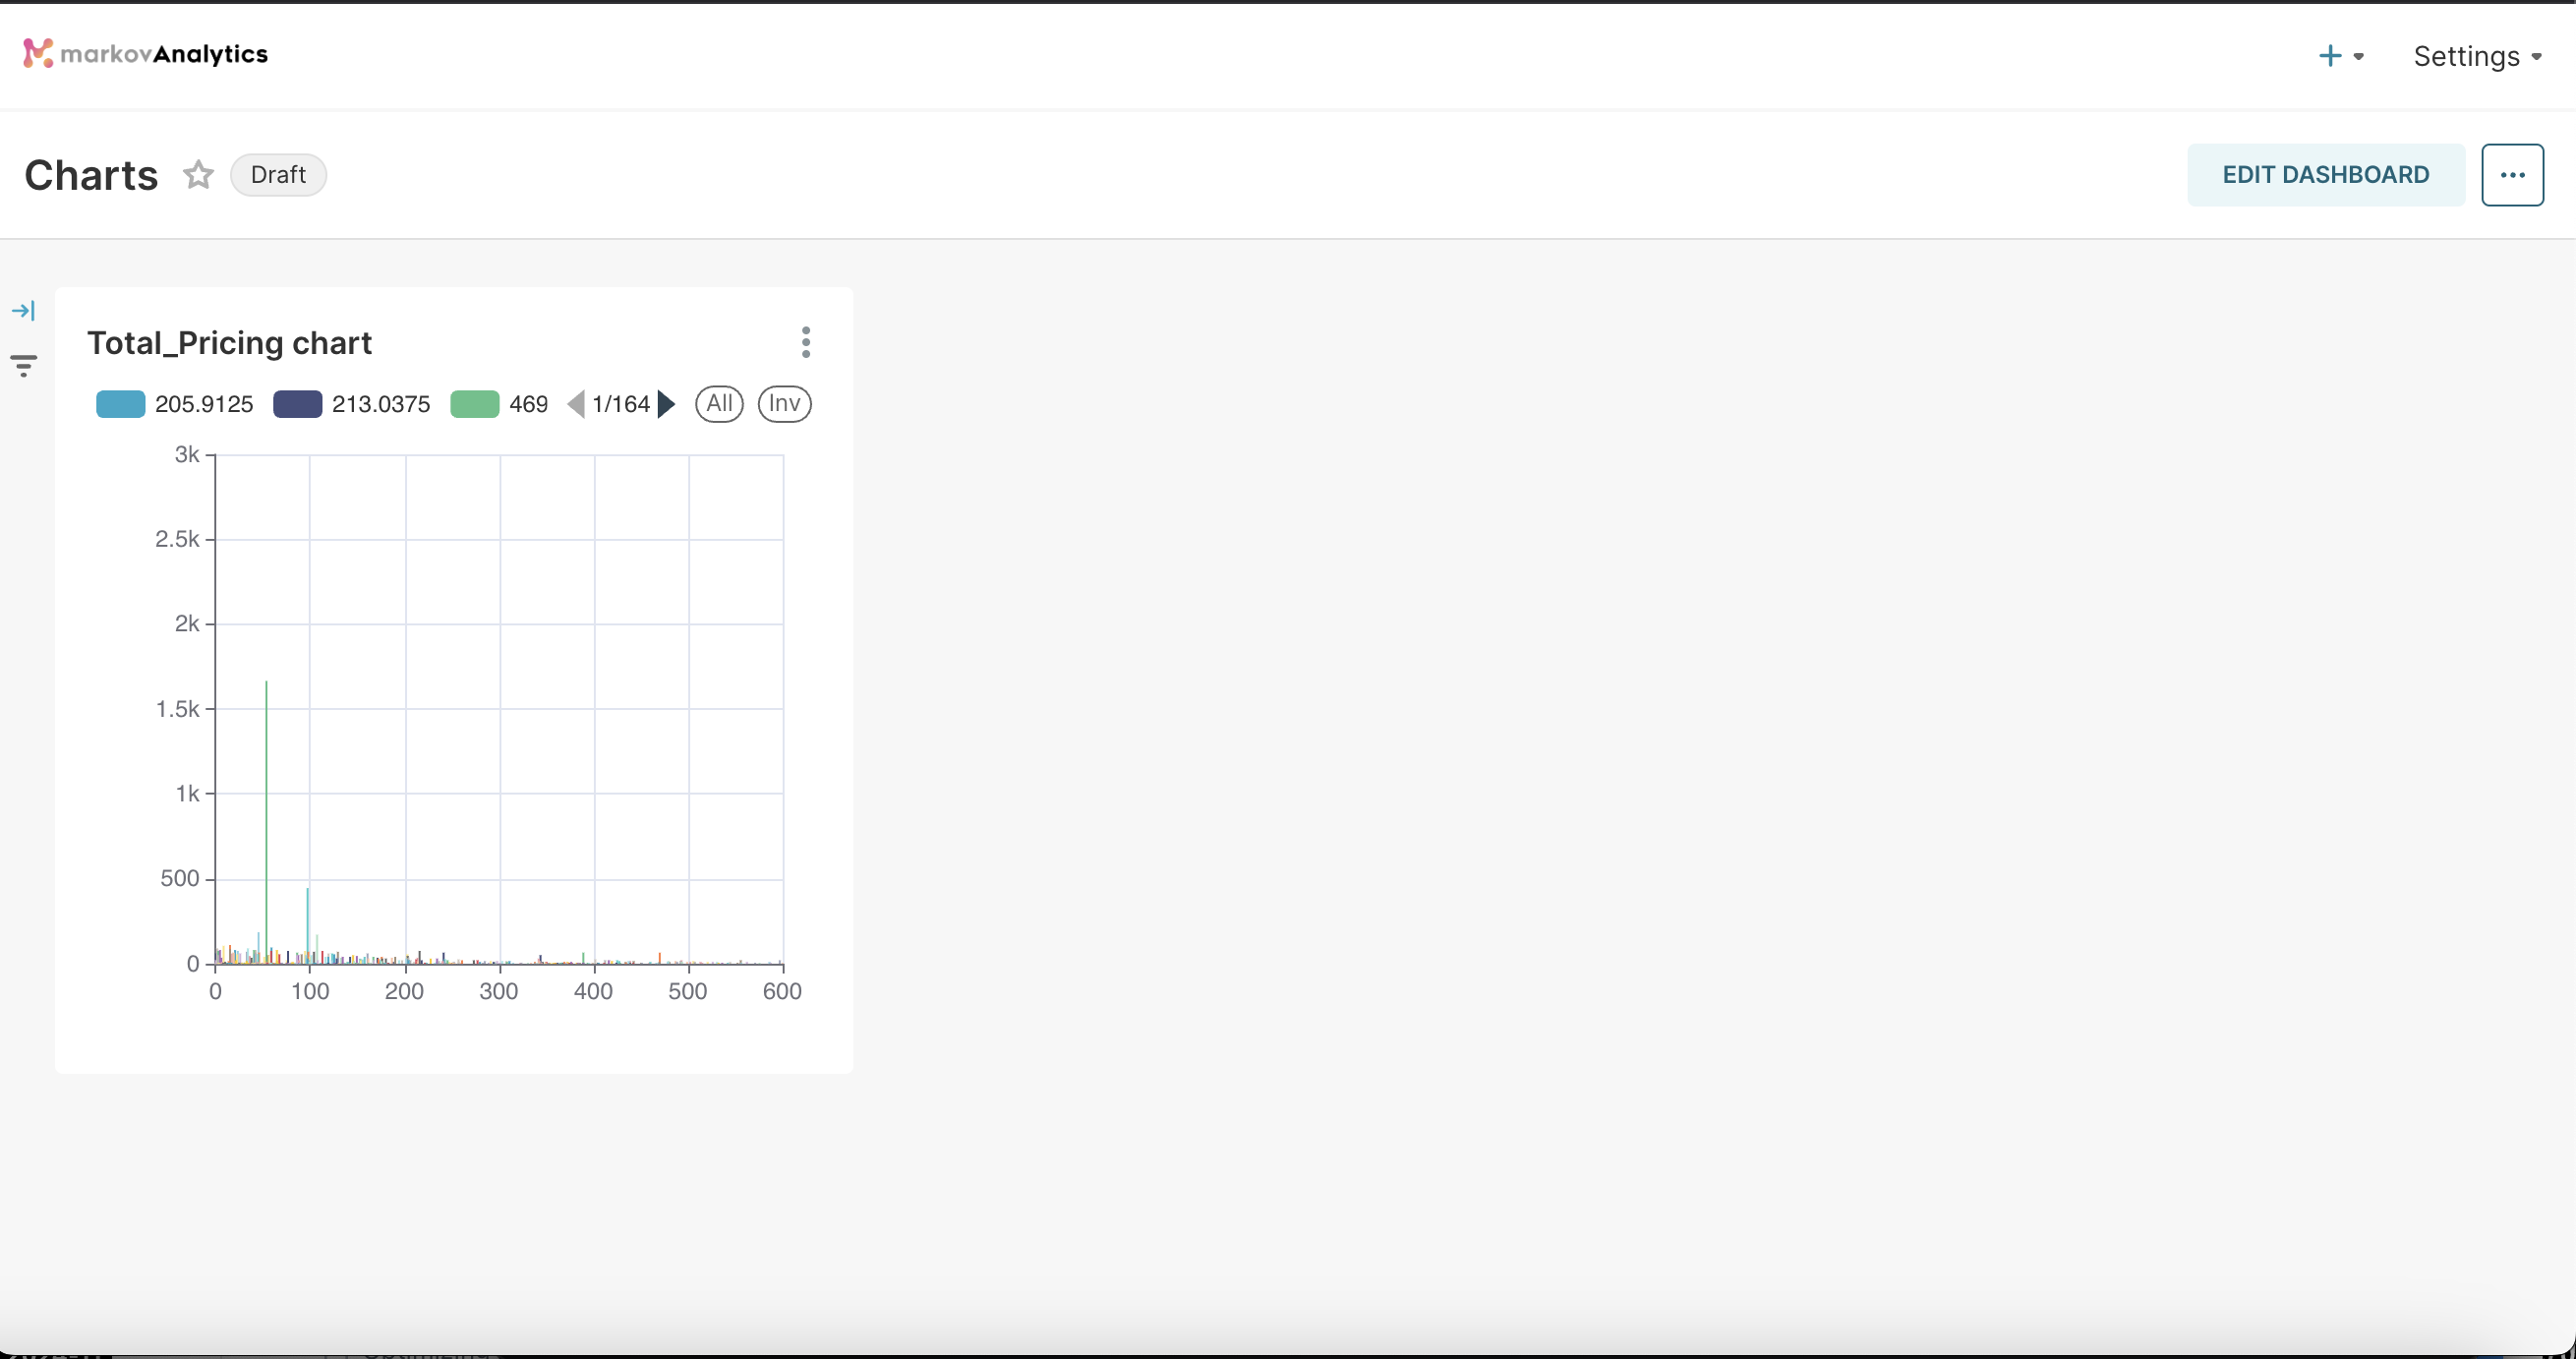
Sample chart
That's it!
Congratulations! You've successfully built a sales forecasting model using AI workflows in MarkovML. You have loaded sample data, selected the appropriate operations, configured the forecasting model, and visualized the results in a dashboard. This process is scalable—once you are comfortable, you can apply it to real-world data to suit your needs.
If you want to explore further, here are some additional tutorials that can help.
Now that you have mastered the basics, you can experiment with different operations and datasets to build more complex AI workflows for your business needs!
Updated 4 months ago
